Hello, what is the best way to get log log plots with error bars? I tried putting log10() everywhere but as I was afraid results look ugly....
thanks,
johann
Hello Johann,
is the problem you are reporting the one I observe in the attached picture?
Namely some vertical and horizontal lines are missing when using
yscale="log". More precisely everything below y=1 seems to be missing.
The picture was generated with the code below and
matplotlib.__version__ = '0.98.6svn'
matplotlib.__revision__ = 'Revision: 6887 '
best regards Matthias

···
###############################
import numpy as np
import matplotlib.pyplot as plt
plt.subplot(111, xscale="log", yscale="log")
x = 10.0**np.linspace(0.0, 2.0, 20)
y = x**2.0
plt.errorbar(x, y, xerr=0.1*x, yerr=5.0+0.75*y)
plt.show()
################################
On Friday 27 March 2009 16:12:12 Cohen-Tanugi Johann wrote:
Hello, what is the best way to get log log plots with error bars? I
tried putting log10() everywhere but as I was afraid results look ugly....
thanks,
johann
yes exactly....
I should have provided a test case, thanks for following up!
Johann
Matthias Michler wrote:
···
Hello Johann,
is the problem you are reporting the one I observe in the attached picture? Namely some vertical and horizontal lines are missing when using yscale="log". More precisely everything below y=1 seems to be missing.
The picture was generated with the code below and
matplotlib.__version__ = '0.98.6svn'
matplotlib.__revision__ = 'Revision: 6887 'best regards Matthias
###############################
import numpy as np
import matplotlib.pyplot as pltplt.subplot(111, xscale="log", yscale="log")
x = 10.0**np.linspace(0.0, 2.0, 20)
y = x**2.0
plt.errorbar(x, y, xerr=0.1*x, yerr=5.0+0.75*y)
plt.show()
################################
On Friday 27 March 2009 16:12:12 Cohen-Tanugi Johann wrote:
Hello, what is the best way to get log log plots with error bars? I
tried putting log10() everywhere but as I was afraid results look ugly....
thanks,
johann
------------------------------------------------------------------------------------------------------------------------------------------------
------------------------------------------------------------------------------
------------------------------------------------------------------------_______________________________________________
Matplotlib-users mailing list
[email protected]
matplotlib-users List Signup and Options
I have to say I don't really have a lot of experience with error bars on log plots -- but the root cause here is that the lower bound of the error bar goes negative, and as we all know, the log of a negative number is undefined. If you can suggest where the lower bound should be drawn or provide third-party examples, I'm happy to look into this further and resolve this "surprise".
Mike
Cohen-Tanugi Johann wrote:
···
yes exactly....
I should have provided a test case, thanks for following up!
JohannMatthias Michler wrote:
Hello Johann,
is the problem you are reporting the one I observe in the attached picture? Namely some vertical and horizontal lines are missing when using yscale="log". More precisely everything below y=1 seems to be missing.
The picture was generated with the code below and
matplotlib.__version__ = '0.98.6svn'
matplotlib.__revision__ = 'Revision: 6887 'best regards Matthias
###############################
import numpy as np
import matplotlib.pyplot as pltplt.subplot(111, xscale="log", yscale="log")
x = 10.0**np.linspace(0.0, 2.0, 20)
y = x**2.0
plt.errorbar(x, y, xerr=0.1*x, yerr=5.0+0.75*y)
plt.show()
################################
On Friday 27 March 2009 16:12:12 Cohen-Tanugi Johann wrote:
Hello, what is the best way to get log log plots with error bars? I
tried putting log10() everywhere but as I was afraid results look ugly....
thanks,
johann
------------------------------------------------------------------------------------------------------------------------------------------------
------------------------------------------------------------------------------
------------------------------------------------------------------------_______________________________________________
Matplotlib-users mailing list
[email protected]
matplotlib-users List Signup and Options
------------------------------------------------------------------------------
_______________________________________________
Matplotlib-users mailing list
[email protected]
matplotlib-users List Signup and Options
--
Michael Droettboom
Science Software Branch
Operations and Engineering Division
Space Telescope Science Institute
Operated by AURA for NASA
I did not look at the code, but I thought that the errors were automatically recomputed in log scale as delta_Y/Y/log(10)
Johann
Michael Droettboom wrote:
···
I have to say I don't really have a lot of experience with error bars on log plots -- but the root cause here is that the lower bound of the error bar goes negative, and as we all know, the log of a negative number is undefined. If you can suggest where the lower bound should be drawn or provide third-party examples, I'm happy to look into this further and resolve this "surprise".
Mike
Cohen-Tanugi Johann wrote:
yes exactly....
I should have provided a test case, thanks for following up!
JohannMatthias Michler wrote:
Hello Johann,
is the problem you are reporting the one I observe in the attached picture? Namely some vertical and horizontal lines are missing when using yscale="log". More precisely everything below y=1 seems to be missing.
The picture was generated with the code below and
matplotlib.__version__ = '0.98.6svn'
matplotlib.__revision__ = 'Revision: 6887 'best regards Matthias
###############################
import numpy as np
import matplotlib.pyplot as pltplt.subplot(111, xscale="log", yscale="log")
x = 10.0**np.linspace(0.0, 2.0, 20)
y = x**2.0
plt.errorbar(x, y, xerr=0.1*x, yerr=5.0+0.75*y)
plt.show()
################################
On Friday 27 March 2009 16:12:12 Cohen-Tanugi Johann wrote:
Hello, what is the best way to get log log plots with error bars? I
tried putting log10() everywhere but as I was afraid results look ugly....
thanks,
johann
------------------------------------------------------------------------------------------------------------------------------------------------
------------------------------------------------------------------------------
------------------------------------------------------------------------
_______________________________________________
Matplotlib-users mailing list
[email protected]
matplotlib-users List Signup and Options
------------------------------------------------------------------------------_______________________________________________
Matplotlib-users mailing list
[email protected]
matplotlib-users List Signup and Options
I tried to look at the code (axes.py I presume) in order to attempt a patch, but it defeated me, I do not have the instructions to navigate through this code ![]()
Where is the actual transform of the error bars occurring?
thanks,
Johann
Michael Droettboom wrote:
···
I have to say I don't really have a lot of experience with error bars on log plots -- but the root cause here is that the lower bound of the error bar goes negative, and as we all know, the log of a negative number is undefined. If you can suggest where the lower bound should be drawn or provide third-party examples, I'm happy to look into this further and resolve this "surprise".
Mike
Cohen-Tanugi Johann wrote:
yes exactly....
I should have provided a test case, thanks for following up!
JohannMatthias Michler wrote:
Hello Johann,
is the problem you are reporting the one I observe in the attached picture? Namely some vertical and horizontal lines are missing when using yscale="log". More precisely everything below y=1 seems to be missing.
The picture was generated with the code below and
matplotlib.__version__ = '0.98.6svn'
matplotlib.__revision__ = 'Revision: 6887 'best regards Matthias
###############################
import numpy as np
import matplotlib.pyplot as pltplt.subplot(111, xscale="log", yscale="log")
x = 10.0**np.linspace(0.0, 2.0, 20)
y = x**2.0
plt.errorbar(x, y, xerr=0.1*x, yerr=5.0+0.75*y)
plt.show()
################################
On Friday 27 March 2009 16:12:12 Cohen-Tanugi Johann wrote:
Hello, what is the best way to get log log plots with error bars? I
tried putting log10() everywhere but as I was afraid results look ugly....
thanks,
johann
------------------------------------------------------------------------------------------------------------------------------------------------
------------------------------------------------------------------------------
------------------------------------------------------------------------
_______________________________________________
Matplotlib-users mailing list
[email protected]
matplotlib-users List Signup and Options
------------------------------------------------------------------------------_______________________________________________
Matplotlib-users mailing list
[email protected]
matplotlib-users List Signup and Options
hello..... Anyone? I would very much love to see this fixed, and I am ready to help out, but I do not know how to browse through the code. Despite the fact that log(errors) should of course not be used, but rathter errors/values/log(10), Michael's point still remains : values- errors in log scale can be negative, so that the artist should just draw a bar until the lower limit of the vertical bar. I would say that this is the standard practice.
Sorry for my previous email beside the point.
Johann
Cohen-Tanugi Johann wrote:
···
I tried to look at the code (axes.py I presume) in order to attempt a patch, but it defeated me, I do not have the instructions to navigate through this code
Where is the actual transform of the error bars occurring?
thanks,
JohannMichael Droettboom wrote:
I have to say I don't really have a lot of experience with error bars on log plots -- but the root cause here is that the lower bound of the error bar goes negative, and as we all know, the log of a negative number is undefined. If you can suggest where the lower bound should be drawn or provide third-party examples, I'm happy to look into this further and resolve this "surprise".
Mike
Cohen-Tanugi Johann wrote:
yes exactly....
I should have provided a test case, thanks for following up!
JohannMatthias Michler wrote:
Hello Johann,
is the problem you are reporting the one I observe in the attached picture? Namely some vertical and horizontal lines are missing when using yscale="log". More precisely everything below y=1 seems to be missing.
The picture was generated with the code below and
matplotlib.__version__ = '0.98.6svn'
matplotlib.__revision__ = 'Revision: 6887 'best regards Matthias
###############################
import numpy as np
import matplotlib.pyplot as pltplt.subplot(111, xscale="log", yscale="log")
x = 10.0**np.linspace(0.0, 2.0, 20)
y = x**2.0
plt.errorbar(x, y, xerr=0.1*x, yerr=5.0+0.75*y)
plt.show()
################################
On Friday 27 March 2009 16:12:12 Cohen-Tanugi Johann wrote:
Hello, what is the best way to get log log plots with error bars? I
tried putting log10() everywhere but as I was afraid results look ugly....
thanks,
johann
------------------------------------------------------------------------------------------------------------------------------------------------
------------------------------------------------------------------------------
------------------------------------------------------------------------
_______________________________________________
Matplotlib-users mailing list
[email protected]
matplotlib-users List Signup and Options
------------------------------------------------------------------------------
_______________________________________________
Matplotlib-users mailing list
[email protected]
matplotlib-users List Signup and Options
------------------------------------------------------------------------------
_______________________________________________
Matplotlib-users mailing list
[email protected]
matplotlib-users List Signup and Options
Cohen-Tanugi Johann wrote:
I tried to look at the code (axes.py I presume) in order to attempt a patch, but it defeated me, I do not have the instructions to navigate through this code
Where is the actual transform of the error bars occurring?
I think it is in the draw (or recache) method of the artists.
The right way to handle this problem is not obvious to me. Maybe with a variant of the log scale that clips instead of masking invalid points. And maybe instead of making a whole set of such variants, the behavior--masking versus clipping, and the clip level if the latter--should be handled by an rcParam.
Eric
···
thanks,
JohannMichael Droettboom wrote:
I have to say I don't really have a lot of experience with error bars on log plots -- but the root cause here is that the lower bound of the error bar goes negative, and as we all know, the log of a negative number is undefined. If you can suggest where the lower bound should be drawn or provide third-party examples, I'm happy to look into this further and resolve this "surprise".
Mike
Cohen-Tanugi Johann wrote:
yes exactly....
I should have provided a test case, thanks for following up!
JohannMatthias Michler wrote:
Hello Johann,
is the problem you are reporting the one I observe in the attached picture? Namely some vertical and horizontal lines are missing when using yscale="log". More precisely everything below y=1 seems to be missing.
The picture was generated with the code below and
matplotlib.__version__ = '0.98.6svn'
matplotlib.__revision__ = 'Revision: 6887 'best regards Matthias
###############################
import numpy as np
import matplotlib.pyplot as pltplt.subplot(111, xscale="log", yscale="log")
x = 10.0**np.linspace(0.0, 2.0, 20)
y = x**2.0
plt.errorbar(x, y, xerr=0.1*x, yerr=5.0+0.75*y)
plt.show()
################################
On Friday 27 March 2009 16:12:12 Cohen-Tanugi Johann wrote:
Hello, what is the best way to get log log plots with error bars? I
tried putting log10() everywhere but as I was afraid results look ugly....
thanks,
johann
It looks like you're all heading down the right path. I'm happy to help (as the original author of the transforms code), but I'm going to be generally unavailable until Thursday or Friday of next week.
Cheers,
Mike
Eric Firing wrote:
···
Cohen-Tanugi Johann wrote:
I tried to look at the code (axes.py I presume) in order to attempt a patch, but it defeated me, I do not have the instructions to navigate through this code
Where is the actual transform of the error bars occurring?I think it is in the draw (or recache) method of the artists.
The right way to handle this problem is not obvious to me. Maybe with a variant of the log scale that clips instead of masking invalid points. And maybe instead of making a whole set of such variants, the behavior--masking versus clipping, and the clip level if the latter--should be handled by an rcParam.
Eric
thanks,
JohannMichael Droettboom wrote:
I have to say I don't really have a lot of experience with error bars on log plots -- but the root cause here is that the lower bound of the error bar goes negative, and as we all know, the log of a negative number is undefined. If you can suggest where the lower bound should be drawn or provide third-party examples, I'm happy to look into this further and resolve this "surprise".
Mike
Cohen-Tanugi Johann wrote:
yes exactly....
I should have provided a test case, thanks for following up!
JohannMatthias Michler wrote:
Hello Johann,
is the problem you are reporting the one I observe in the attached picture? Namely some vertical and horizontal lines are missing when using yscale="log". More precisely everything below y=1 seems to be missing.
The picture was generated with the code below and
matplotlib.__version__ = '0.98.6svn'
matplotlib.__revision__ = 'Revision: 6887 'best regards Matthias
###############################
import numpy as np
import matplotlib.pyplot as pltplt.subplot(111, xscale="log", yscale="log")
x = 10.0**np.linspace(0.0, 2.0, 20)
y = x**2.0
plt.errorbar(x, y, xerr=0.1*x, yerr=5.0+0.75*y)
plt.show()
################################
On Friday 27 March 2009 16:12:12 Cohen-Tanugi Johann wrote:
Hello, what is the best way to get log log plots with error bars? I
tried putting log10() everywhere but as I was afraid results look ugly....
thanks,
johann
--
Michael Droettboom
Science Software Branch
Operations and Engineering Division
Space Telescope Science Institute
Operated by AURA for NASA
hello,
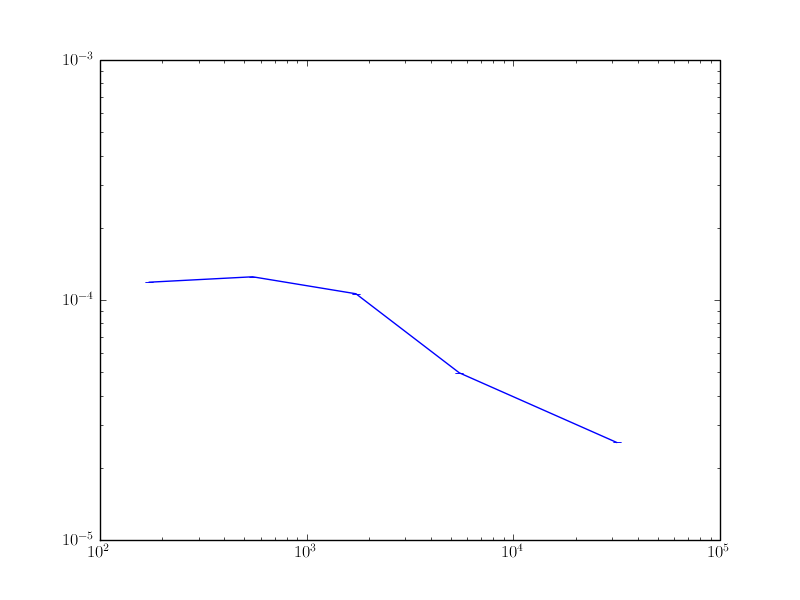
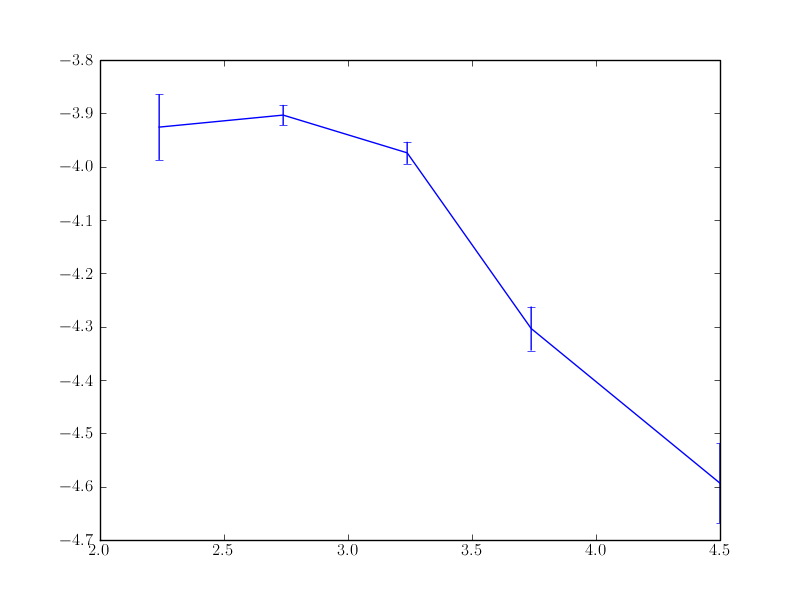
for the sake of concreteness, here is an example without any limit issues : the python script is attached and the 2 resulting figures as well. The dirst one is drawn using log directly in the arguments, and correctly transforming the y-errors into y-errors/y-values/log(10). In the second figure, I use the log scaling in x and y. Clearly something goes wrong with plotting the error bars, and the y-scale limits also seem ill chosen....
HTH debugging this. I looked again at the code, but I am decidedly lost as to where the error bar plotting occurs, and where it gets modified by the log scale request.
Johann
Cohen-Tanugi Johann wrote:
test_mplScale.py (910 Bytes)
···
hello..... Anyone? I would very much love to see this fixed, and I am ready to help out, but I do not know how to browse through the code. Despite the fact that log(errors) should of course not be used, but rathter errors/values/log(10), Michael's point still remains : values- errors in log scale can be negative, so that the artist should just draw a bar until the lower limit of the vertical bar. I would say that this is the standard practice.
Sorry for my previous email beside the point.
JohannCohen-Tanugi Johann wrote:
I tried to look at the code (axes.py I presume) in order to attempt a patch, but it defeated me, I do not have the instructions to navigate through this code
Where is the actual transform of the error bars occurring?
thanks,
JohannMichael Droettboom wrote:
I have to say I don't really have a lot of experience with error bars on log plots -- but the root cause here is that the lower bound of the error bar goes negative, and as we all know, the log of a negative number is undefined. If you can suggest where the lower bound should be drawn or provide third-party examples, I'm happy to look into this further and resolve this "surprise".
Mike
Cohen-Tanugi Johann wrote:
yes exactly....
I should have provided a test case, thanks for following up!
JohannMatthias Michler wrote:
Hello Johann,
is the problem you are reporting the one I observe in the attached picture? Namely some vertical and horizontal lines are missing when using yscale="log". More precisely everything below y=1 seems to be missing.
The picture was generated with the code below and
matplotlib.__version__ = '0.98.6svn'
matplotlib.__revision__ = 'Revision: 6887 'best regards Matthias
###############################
import numpy as np
import matplotlib.pyplot as pltplt.subplot(111, xscale="log", yscale="log")
x = 10.0**np.linspace(0.0, 2.0, 20)
y = x**2.0
plt.errorbar(x, y, xerr=0.1*x, yerr=5.0+0.75*y)
plt.show()
################################
On Friday 27 March 2009 16:12:12 Cohen-Tanugi Johann wrote:
Hello, what is the best way to get log log plots with error bars? I
tried putting log10() everywhere but as I was afraid results look ugly....
thanks,
johann
------------------------------------------------------------------------------------------------------------------------------------------------
------------------------------------------------------------------------------
------------------------------------------------------------------------
_______________________________________________
Matplotlib-users mailing list
[email protected]
matplotlib-users List Signup and Options
------------------------------------------------------------------------------
_______________________________________________
Matplotlib-users mailing list
[email protected]
matplotlib-users List Signup and Options
------------------------------------------------------------------------------_______________________________________________
Matplotlib-users mailing list
[email protected]
matplotlib-users List Signup and Options
ok, maybe it is in scale.py ![]()
And what I see there confirms my initial fears : the log scale transform applies a log to the argument, which is incorrect for an error..... So first of all, another transform needs to be created so that erry is transformed into erry/y/log(base) where base was 10 in my example.
past midnight here.... I will see tomorrow if I find time to try out a patch (not the easiest entry point for starting developer's activities in MPL I am afraid....)
Johann
Cohen-Tanugi Johann wrote:
···
hello,
for the sake of concreteness, here is an example without any limit issues : the python script is attached and the 2 resulting figures as well. The dirst one is drawn using log directly in the arguments, and correctly transforming the y-errors into y-errors/y-values/log(10). In the second figure, I use the log scaling in x and y. Clearly something goes wrong with plotting the error bars, and the y-scale limits also seem ill chosen....HTH debugging this. I looked again at the code, but I am decidedly lost as to where the error bar plotting occurs, and where it gets modified by the log scale request.
Johann
Cohen-Tanugi Johann wrote:
hello..... Anyone? I would very much love to see this fixed, and I am ready to help out, but I do not know how to browse through the code. Despite the fact that log(errors) should of course not be used, but rathter errors/values/log(10), Michael's point still remains : values- errors in log scale can be negative, so that the artist should just draw a bar until the lower limit of the vertical bar. I would say that this is the standard practice.
Sorry for my previous email beside the point.
JohannCohen-Tanugi Johann wrote:
I tried to look at the code (axes.py I presume) in order to attempt a patch, but it defeated me, I do not have the instructions to navigate through this code
Where is the actual transform of the error bars occurring?
thanks,
JohannMichael Droettboom wrote:
I have to say I don't really have a lot of experience with error bars on log plots -- but the root cause here is that the lower bound of the error bar goes negative, and as we all know, the log of a negative number is undefined. If you can suggest where the lower bound should be drawn or provide third-party examples, I'm happy to look into this further and resolve this "surprise".
Mike
Cohen-Tanugi Johann wrote:
yes exactly....
I should have provided a test case, thanks for following up!
JohannMatthias Michler wrote:
Hello Johann,
is the problem you are reporting the one I observe in the attached picture? Namely some vertical and horizontal lines are missing when using yscale="log". More precisely everything below y=1 seems to be missing.
The picture was generated with the code below and
matplotlib.__version__ = '0.98.6svn'
matplotlib.__revision__ = 'Revision: 6887 'best regards Matthias
###############################
import numpy as np
import matplotlib.pyplot as pltplt.subplot(111, xscale="log", yscale="log")
x = 10.0**np.linspace(0.0, 2.0, 20)
y = x**2.0
plt.errorbar(x, y, xerr=0.1*x, yerr=5.0+0.75*y)
plt.show()
################################
On Friday 27 March 2009 16:12:12 Cohen-Tanugi Johann wrote:
Hello, what is the best way to get log log plots with error bars? I
tried putting log10() everywhere but as I was afraid results look ugly....
thanks,
johann
------------------------------------------------------------------------------------------------------------------------------------------------
------------------------------------------------------------------------------
------------------------------------------------------------------------
_______________________________________________
Matplotlib-users mailing list
[email protected]
matplotlib-users List Signup and Options
------------------------------------------------------------------------------
_______________________________________________
Matplotlib-users mailing list
[email protected]
matplotlib-users List Signup and Options
------------------------------------------------------------------------------_______________________________________________
Matplotlib-users mailing list
[email protected]
matplotlib-users List Signup and Options
------------------------------------------------------------------------------------------------------------------------------------------------
------------------------------------------------------------------------
------------------------------------------------------------------------------
------------------------------------------------------------------------_______________________________________________
Matplotlib-users mailing list
[email protected]
matplotlib-users List Signup and Options
Cohen-Tanugi Johann wrote:
ok, maybe it is in scale.py
And what I see there confirms my initial fears : the log scale transform applies a log to the argument, which is incorrect for an error..... So first of all, another transform needs to be created so that erry is transformed into erry/y/log(base) where base was 10 in my example.
Johann,
I don't understand your objection here. It seems to me that an errorbar should always be in the same units, and on the same scale, as the point to which it applies. Therefore when switching from linear to log scales, one simply plots the same data and error ranges on a log scale instead of a linear scale. This is what mpl does. If what you want is for the error to be proportional to the value of the point, then you need to specify the error bounds so that they have that property. For estimation of a power spectrum, for example, this is often the case; the error bars are some fraction (depending on the equivalent number of degrees of freedom) of the spectral level at each frequency, so on a log plot they will have equal length. It is not the job of the errorbar function to figure that out, however.
If I am misunderstanding, then please provide a very simple concrete example that will make your point clear.
past midnight here.... I will see tomorrow if I find time to try out a patch (not the easiest entry point for starting developer's activities in MPL I am afraid....)
I have just committed a change (trunk r7023) that allows non-positive numbers to be clipped to a small positive value. To illustrate its use with an errorbar, I added the example provided by Matthias to examples/pylab_examples/log_demo.py, as a 4th subplot.
Eric
···
Johann
hi Eric, then I misunderstood what the code does.... I thought it was transforming the data. In any case, my second figure in my previous post is wrong because the code should read:
plt.errorbar(cE,corrE*fluxes, yerr=corrE*unc_fluxes)
instead of
plt.errorbar(cE,corrE*fluxes, yerr=unc_fluxes)
and indeed this seems to behave correctly, so I guess I got completely confused while trying to understand what was happening. I will check out your patch and start from the beginning.
thanks a lot and sorry,
Johann
Eric Firing wrote:
···
Cohen-Tanugi Johann wrote:
ok, maybe it is in scale.py
And what I see there confirms my initial fears : the log scale transform applies a log to the argument, which is incorrect for an error..... So first of all, another transform needs to be created so that erry is transformed into erry/y/log(base) where base was 10 in my example.Johann,
I don't understand your objection here. It seems to me that an errorbar should always be in the same units, and on the same scale, as the point to which it applies. Therefore when switching from linear to log scales, one simply plots the same data and error ranges on a log scale instead of a linear scale. This is what mpl does. If what you want is for the error to be proportional to the value of the point, then you need to specify the error bounds so that they have that property. For estimation of a power spectrum, for example, this is often the case; the error bars are some fraction (depending on the equivalent number of degrees of freedom) of the spectral level at each frequency, so on a log plot they will have equal length. It is not the job of the errorbar function to figure that out, however.
If I am misunderstanding, then please provide a very simple concrete example that will make your point clear.
past midnight here.... I will see tomorrow if I find time to try out a patch (not the easiest entry point for starting developer's activities in MPL I am afraid....)
I have just committed a change (trunk r7023) that allows non-positive numbers to be clipped to a small positive value. To illustrate its use with an errorbar, I added the example provided by Matthias to examples/pylab_examples/log_demo.py, as a 4th subplot.
Eric
Johann
indeed, I obviously just got entangled in my own debugging. I do manage to get it to do what I want now.
sorry for the fuss,
Johann
Eric Firing wrote:
···
Cohen-Tanugi Johann wrote:
ok, maybe it is in scale.py
And what I see there confirms my initial fears : the log scale transform applies a log to the argument, which is incorrect for an error..... So first of all, another transform needs to be created so that erry is transformed into erry/y/log(base) where base was 10 in my example.Johann,
I don't understand your objection here. It seems to me that an errorbar should always be in the same units, and on the same scale, as the point to which it applies. Therefore when switching from linear to log scales, one simply plots the same data and error ranges on a log scale instead of a linear scale. This is what mpl does. If what you want is for the error to be proportional to the value of the point, then you need to specify the error bounds so that they have that property. For estimation of a power spectrum, for example, this is often the case; the error bars are some fraction (depending on the equivalent number of degrees of freedom) of the spectral level at each frequency, so on a log plot they will have equal length. It is not the job of the errorbar function to figure that out, however.
If I am misunderstanding, then please provide a very simple concrete example that will make your point clear.
past midnight here.... I will see tomorrow if I find time to try out a patch (not the easiest entry point for starting developer's activities in MPL I am afraid....)
I have just committed a change (trunk r7023) that allows non-positive numbers to be clipped to a small positive value. To illustrate its use with an errorbar, I added the example provided by Matthias to examples/pylab_examples/log_demo.py, as a 4th subplot.
Eric
Johann
Cohen-Tanugi Johann wrote:
indeed, I obviously just got entangled in my own debugging. I do manage to get it to do what I want now.
sorry for the fuss,
Johann
No problem at all. I'm glad things are working for you.
Eric