Matplotlib Folks,
I tried to use the orthographic projection in the basemap
toolkit and I’m finding that the parallel lines are not behaving
correctly, i.e., there are horizontal lines connecting the left and right side
of the map boundary where a curved latitude line intersects the map boundary.
I’ve included a sample script below and a figure illustrating the
problem.
import pylab
import mpl_toolkits.basemap as basemap
ortho = basemap.Basemap(projection=‘ortho’,lon_0=0,lat_0=50,rsphere=1737.4)
ortho.drawparallels(pylab.arange(-90,90,30))
ortho.drawmeridians(pylab.arange(0,360,30))
ortho.drawmapboundary(fill_color=‘w’)
In addition, how do I change the x/y coordinates the center of
the projection to be (0,0)? With the above code, the center of the bounding
circle is at (1737.4,1737.4).
Thanks for the help,
Sara
PS I’m working on a linux machine and below is the
version information.
Basemap Version Info:
version = ‘0.99.4’
Matplotlib Version Info:
version = ‘0.98.6svn’
revision = ‘Revision: 6887 ’
date = ‘Date: 2009-02-05
18:51:24 -0800 (Thu, 05 Feb 2009) ’
Hatch, Sara J wrote:
Matplotlib Folks,
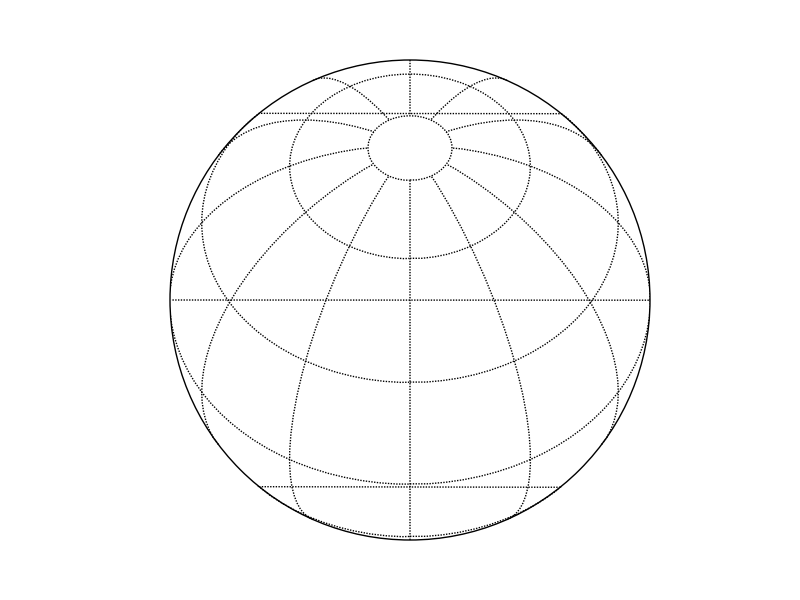
I tried to use the orthographic projection in the basemap toolkit and I’m finding that the parallel lines are not behaving correctly, i.e., there are horizontal lines connecting the left and right side of the map boundary where a curved latitude line intersects the map boundary. I’ve included a sample script below and a figure illustrating the problem.
import pylab
import mpl_toolkits.basemap as basemap
ortho = basemap.Basemap(projection='ortho',lon_0=0,lat_0=50,rsphere=1737.4)
ortho.drawparallels(pylab.arange(-90,90,30))
ortho.drawmeridians(pylab.arange(0,360,30))
ortho.drawmapboundary(fill_color='w')
In addition, how do I change the x/y coordinates the center of the projection to be (0,0)? With the above code, the center of the bounding circle is at (1737.4,1737.4).
Thanks for the help,
Sara
Sara: If you take out the rsphere=1734.4 (thereby using the default value of 6370997), the jumpy lines go away. rsphere=1734.4 means assume the earth is a perfect sphere with a radius of 1734.4 meters. That's an awfully small earth - I think the jumpy lines are a result of roundoff errors in the map projection calculation for very small spheres. Still, that shouldn't happen, so I will look into it.
Regarding the x/y coordinate of the middle of the plot - Basemap assigns the lower left corner of the map projection region an x/y value of 0,0 for most map projections.
-Jeff