Hello.
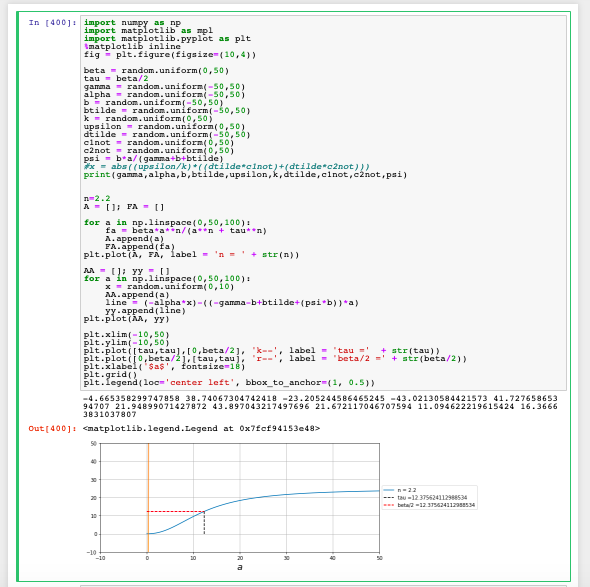
I am working on the intersection of two equations; one is a Hill function (sigmoid curve) and the other a basic straight line. For example, I have two variables x and a, where x is known (although dependent on parameters, seen commented out in the below picture) and I want to illustrate if the variable “line” either (1) does not intersect with the Hill function, (2) intersects only once with the Hill function, or (3) intersects three times with the Hill function (for stability analysis). When I conduct basic tests on my variable “line” (representing the straight line), such as omitting one half of the equation (where only -alphax remains) and tested for various values of alpha (randomized). But when alpha becomes negative, the line is given with a positive slope, and the same result happens when I complete the equation (all terms after -alphax). I am not sure why the basic equation of a line is not plotting correctly. Maybe it has something to do with how I am plotting them or using the append() functions, but I could really use some help.
Thank you.
Using Jupyter Notebook in Python 3.