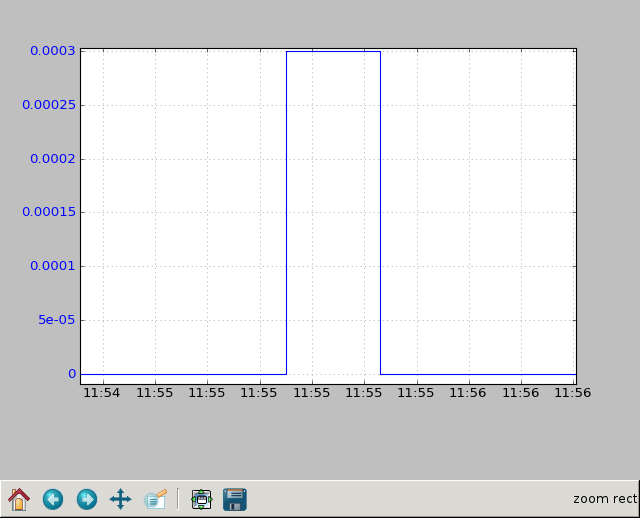
I have a small matplotlib app I wrote to plot columns of a CSV files.
The X axis is almost always time. Once displayed, I will often zoom in
on a small patch of a plot. I'm currently selecting the strftime
format based on the original time range of the input. As I zoom in,
however, that doesn't work so well. Consider the attached plot.
How do I trigger a recalculation of the X axis format? I see this
class, which looks promising:
http://matplotlib.org/api/dates_api.html#matplotlib.dates.AutoDateFormatter
but when I use it in the obvious way, all I get is the current year
for all tick labels, despite the fact that the scaled attribute of the
formatter has keys which are much smaller than a year.
formatter = matplotlib.dates.AutoDateFormatter(
matplotlib.dates.AutoDateLocator())
print formatter.scaled
The default scaled attribute displays as:
{1.0: '%b %d %Y', 365.0: '%Y', 30.0: '%b %Y',
0.041666666666666664: '%H:%M:%S'}
I'm plotting data now with a range of about four hours, so I think the
last format (%H:%M:%S) should be used.
Thx,
Skip
I have a small matplotlib app I wrote to plot columns of a CSV files.
The X axis is almost always time. Once displayed, I will often zoom in
on a small patch of a plot. I'm currently selecting the strftime
format based on the original time range of the input. As I zoom in,
however, that doesn't work so well....
but when I use it in the obvious way, all I get is the current year
for all tick labels, despite the fact that the scaled attribute of the
formatter has keys which are much smaller than a year.
I kind of got this working. I had to associate the locator with the X
axis and call it's autoscale() method before calling plot.show(). Now
I get %H:%M:%S formatting for everything, even when I'm zoomed way out
on a data set containing two-days worth of time series data. I
suppose I can fiddle with the AutoDateFormatter's scaled attribute,
but the default looks like it ought to work. Any thoughts on what I'm
(still) missing?
The locator/formatter code looks like this:
locator = matplotlib.dates.AutoDateLocator()

formatter = matplotlib.dates.AutoDateFormatter(locator)

...

left_plot = figure.add_subplot(111)

left_plot.set_title(title)

left_plot.set_axisbelow(True)

left_plot.yaxis.set_major_formatter(pylab.FormatStrFormatter('%g'))

...

locator.set_axis(left_plot.xaxis)

left_plot.xaxis.set_major_formatter(formatter)

locator.autoscale()

pylab.show()
This works fine except for the lack of dynamic scaling and apparently
incorrect choice of labels on plots over large time scales.
Skip
This surprises me as the AutoDateFormatter automatically kicks in once you pass through some datetime objects, and the AutoDateFormatter & Locator do the right thing when zooming (the format changes depending on the temporal resolution). For example, the following code behaves nicely when I zoom in to a small segment of the line:
import datetime as dt
import numpy as np
import matplotlib.pyplot as plt
d1 = dt.datetime(1990, 1, 1)
n = 365
x = np.array([d1 + dt.timedelta(days=i) for i in range(n)], dtype=object)
y = np.sin(np.linspace(0, np.pi * 2, n))
plt.plot(x, y)
plt.show()
Are you definately passing through datetime objects, or are you passing through the datetime “ordinals” / Julian time?
Cheers,
Phil
···
On 11 July 2013 16:04, Skip Montanaro <skip@…4401…89…> wrote:
I have a small matplotlib app I wrote to plot columns of a CSV files.
The X axis is almost always time. Once displayed, I will often zoom in
on a small patch of a plot. I’m currently selecting the strftime
format based on the original time range of the input. As I zoom in,
however, that doesn’t work so well…
but when I use it in the obvious way, all I get is the current year
for all tick labels, despite the fact that the scaled attribute of the
formatter has keys which are much smaller than a year.
I kind of got this working. I had to associate the locator with the X
axis and call it’s autoscale() method before calling plot.show(). Now
I get %H:%M:%S formatting for everything, even when I’m zoomed way out
on a data set containing two-days worth of time series data. I
suppose I can fiddle with the AutoDateFormatter’s scaled attribute,
but the default looks like it ought to work. Any thoughts on what I’m
(still) missing?
The locator/formatter code looks like this:
locator = matplotlib.dates.AutoDateLocator()
formatter = matplotlib.dates.AutoDateFormatter(locator)
...
left_plot = figure.add_subplot(111)
left_plot.set_title(title)
left_plot.set_axisbelow(True)
left_plot.yaxis.set_major_formatter(pylab.FormatStrFormatter('%g'))
...
locator.set_axis(left_plot.xaxis)
left_plot.xaxis.set_major_formatter(formatter)
locator.autoscale()
pylab.show()
This works fine except for the lack of dynamic scaling and apparently
incorrect choice of labels on plots over large time scales.
Skip
See everything from the browser to the database with AppDynamics
Get end-to-end visibility with application monitoring from AppDynamics
Isolate bottlenecks and diagnose root cause in seconds.
Start your free trial of AppDynamics Pro today!
http://pubads.g.doubleclick.net/gampad/clk?id=48808831&iu=/4140/ostg.clktrk
Matplotlib-users mailing list
[email protected]
https://lists.sourceforge.net/lists/listinfo/matplotlib-users
Are you definately passing through datetime objects, or are you passing
through the datetime "ordinals" / Julian time?
Definitely datetime objects:
if xtime:
min_x = datetime.datetime(9999, 12, 31, 23, 59, 59)
max_x = datetime.datetime(1970, 1, 1, 0, 0, 0)
def parse_x(x):
try:
return dateutil.parser.parse(x)
except ValueError:
print >> sys.stderr, "Can't parse", repr(x), "as a timestamp."
raise
...
You're suggesting that I shouldn't have to do anything with formatters
and locators if my X values are datetime objects? Maybe I should
simply scrub any locator/formatter initialization altogether. When I
first started this little tool I used a FuncFormatter which (unknown
to me) performed about like the AutoDateFormatter without the "Auto"
part. It simply selected the X axis format based on the range of the
data.
Skip
You're suggesting that I shouldn't have to do anything with formatters
and locators if my X values are datetime objects? Maybe I should
simply scrub any locator/formatter initialization altogether.
Did that. Works just as before with my custom FuncFormatter, and with
my explicit AutoDateFormatter. Hmmm... Looking at the default scaled
dictionary, I suspect I failed to understand exactly what its scale
is. Perhaps all the examples I've used so far have generally been
less than 24 hours in duration. Let me play with that, but ask a
corollary question: Is there some way to get the x axis to display
fractions of a second? There is no strftime format character
corresponding to that. (I proposed one on python-dev several years
ago, but I don't think it was ever adopted.)
Thx,
Skip
Is there some way to get the x axis to display
fractions of a second? There is no strftime format character
corresponding to that. (I proposed one on python-dev several years
ago, but I don't think it was ever adopted.)
My memory failed me. I not only proposed, but submitted the necessary
patches which were accepted. However, this only works for datetime
objects:
import datetime
datetime.datetime.now().strftime("%H:%M:%S.%f")
'08:58:57.854562'
It's not supported by time.strftime:
import time
time.time()
1373637581.478104
time.strftime("%H:%M:%S.%f", time.localtime())
'09:00:10.%f'
which I suspect is what matplotlib uses if it converts datetime
objects to floats internally.
Skip
···
On Fri, Jul 12, 2013 at 8:47 AM, Skip Montanaro <[email protected]...> wrote:
Let me return to my FuncFormatter usage. As I indicated in an earlier
post, I made a single format decision based on the x range of the
entire data set. The decision code was straightforward:
x_delta = x_range[1] - x_range[0]
if x_delta > int(1.5 * 365) * ONE_DAY:
xfmt = "%Y-%m-%d"
elif x_delta > 2 * ONE_DAY:
xfmt = "%m/%d\n%H:%M"
elif x_delta < 2 * ONE_HOUR:
xfmt = "%H:%M:%S"
else:
xfmt = "%H:%M"
How do I compute x_delta as it relates to the currently visible
window? In the above code, x_range represents the x range of my
entire data set.
Thx,
Skip
Skip,
I am not at all familiar with dates in matplotlib, but what does plt.xlim() yield? Or are the limits not updated before calling the tick formatter?
-Sterling
···
On Jul 12, 2013, at 8:49AM, Skip Montanaro wrote:
Let me return to my FuncFormatter usage. As I indicated in an earlier
post, I made a single format decision based on the x range of the
entire data set. The decision code was straightforward:
x_delta = x_range[1] - x_range[0]
if x_delta > int(1.5 * 365) * ONE_DAY:
xfmt = "%Y-%m-%d"
elif x_delta > 2 * ONE_DAY:
xfmt = "%m/%d\n%H:%M"
elif x_delta < 2 * ONE_HOUR:
xfmt = "%H:%M:%S"
else:
xfmt = "%H:%M"
How do I compute x_delta as it relates to the currently visible
window? In the above code, x_range represents the x range of my
entire data set.
Thx,
Skip
------------------------------------------------------------------------------
See everything from the browser to the database with AppDynamics
Get end-to-end visibility with application monitoring from AppDynamics
Isolate bottlenecks and diagnose root cause in seconds.
Start your free trial of AppDynamics Pro today!
http://pubads.g.doubleclick.net/gampad/clk?id=48808831&iu=/4140/ostg.clktrk
_______________________________________________
Matplotlib-users mailing list
[email protected]
matplotlib-users List Signup and Options
I am not at all familiar with dates in matplotlib, but what does plt.xlim() yield? Or are the limits not updated before calling the tick formatter?
Bingo! I changed "plt" to "pylab" and now I have access to the x
range of the current viewport.
Thanks,
Skip