Jeff,
sorry I am bothering you with my postings 
Maybe I am missing something, but your way looks too complicated to
me....
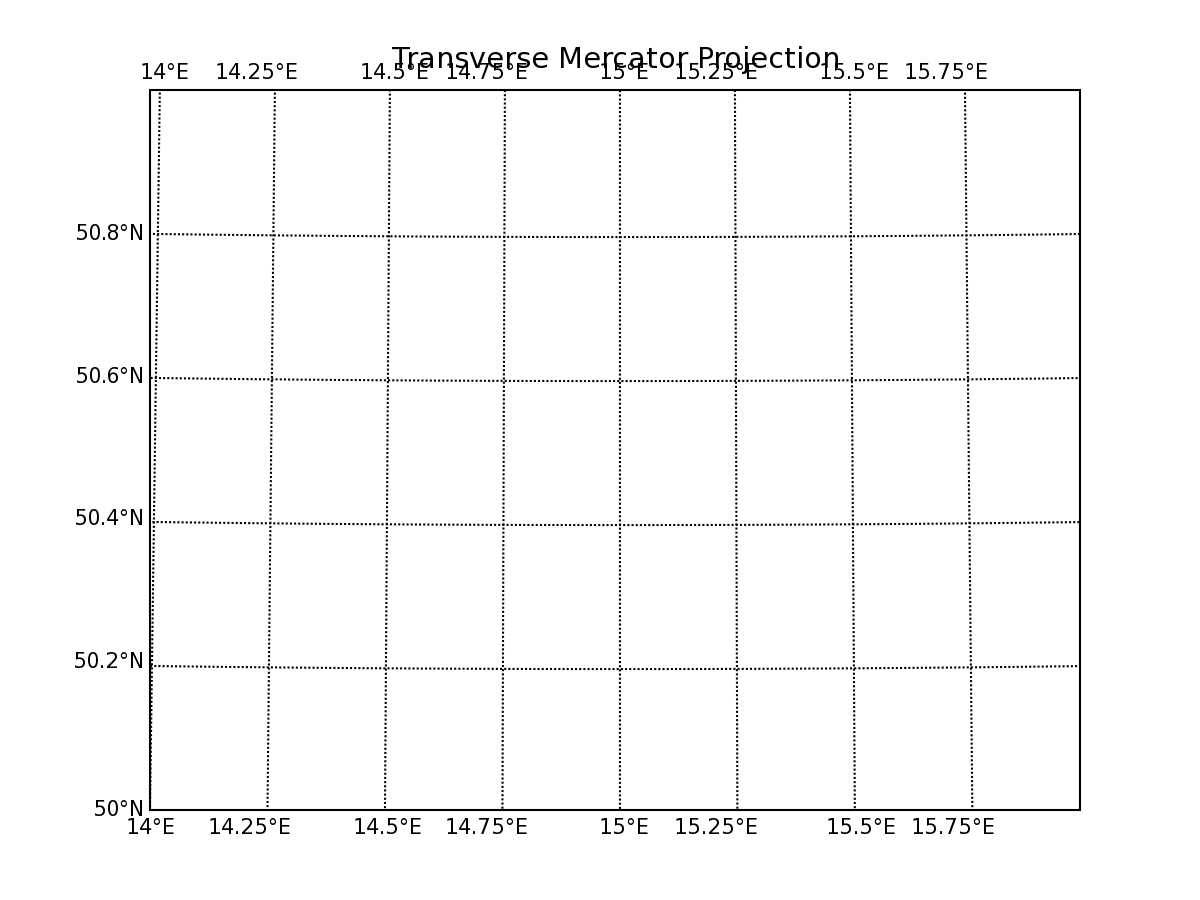
below code works for me. BUT!!!: I just wonder, why meridians are not
plotted symmetrically to the vertical axis. Because of that it will be
a little bit more difficult to adjust (calibrate) my map (picture)
properly. Try to run the code without an image (as it is) and
you will see it.
Anyway, if you think the following code is fundamentally correct, I
can post my experiences how to scan the paper map and how to
"calibrate" scanned picture, so it can be shown with the Basemap
coordinates properly.
Petr
···
=======================================
from matplotlib.toolkits.basemap import Basemap
from pylab import *
m = Basemap(llcrnrlon=14.,llcrnrlat=50,urcrnrlon=16.,urcrnrlat=51.,\
resolution='c',area_thresh=10.,projection='tmerc',\
lat_0=50.,lon_0=15.)
##import Image
##ima=Image.open('/root/Desktop/native_nslu2/sejmout0006.jpg')
##ima1=ima.transform((1545,1730),Image.QUAD, (0,209,0,1940,1535,1938,1530,207))
##im = m.imshow(ima1)
# draw parallels
delat = 0.2
circles = arange(50.,51.,delat)
m.drawparallels(circles,labels=[1,0,0,0],fontsize=10)
# draw meridians
delon = 0.25
meridians = arange(14,16,delon)
m.drawmeridians(meridians,labels=[0,0,1,0],fontsize=10)
title('Transverse Mercator Projection')
# print 'plotting Transverse Mercator example, close plot window to proceed ...'
show()