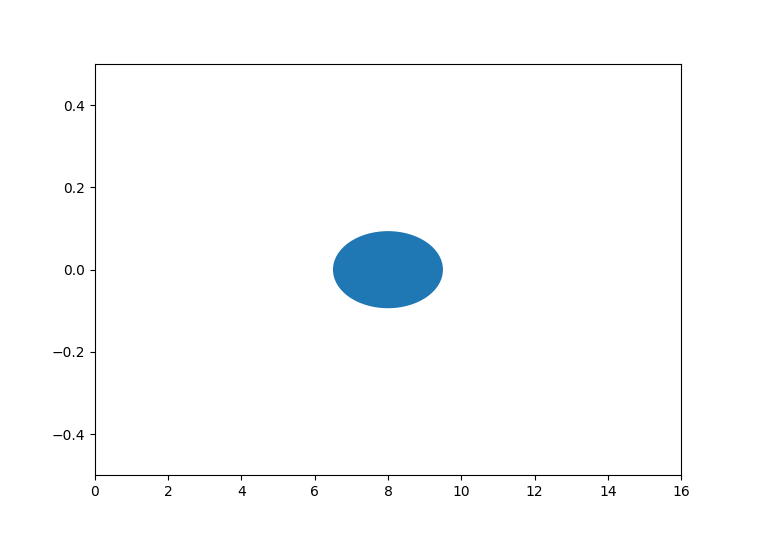
Context: I’m trying to display the gradients as fixed-length lines on a plot of gradient noise. Each “gradient” can be seen as a tangent on a given point. The issue is, even if I make sure the lines have the same length, the aspect ratio stretches them:
The complete code to generate this:
from math import sqrt, floor
import matplotlib.pyplot as plt
mix = lambda a, b, x: a*(1-x) + b*x
interpolant = lambda t: ((6*t - 15)*t + 10)*t*t*t
rng01 = lambda x: ((1103515245*x + 12345) % 2**32) / 2**32
def _gradient_noise(t):
i = floor(t)
f = t - i
s0 = rng01(i) * 2 - 1
s1 = rng01(i + 1) * 2 - 1
v0 = s0 * f;
v1 = s1 * (f - 1);
return mix(v0, v1, interpolant(f))
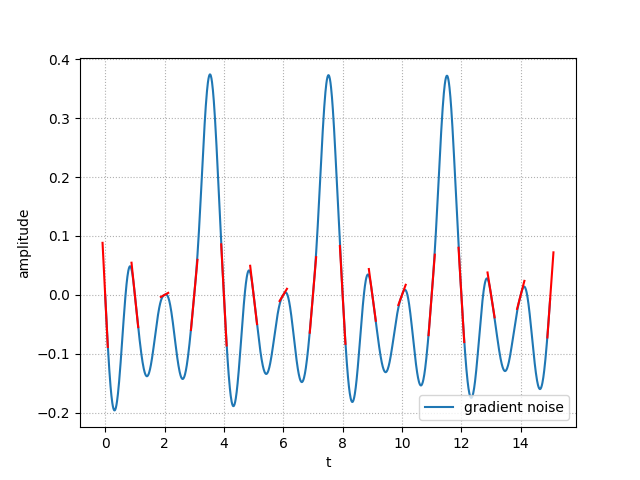
def _plot_noise(n, interp_npoints=100):
xdata = [i/interp_npoints for i in range(n * interp_npoints)]
gnoise = [_gradient_noise(x) for x in xdata]
plt.plot(xdata, gnoise, label='gradient noise')
plt.xlabel('t')
plt.ylabel('amplitude')
plt.grid(linestyle=':')
plt.legend()
for i in range(n + 1):
a = rng01(i) * 2 - 1 # gradient slope
norm = sqrt(1 + a**2)
norm *= 4 # 1/4 length
vnx, vny = 1/norm, a/norm
x = (i-vnx/2, i+vnx/2)
y = (-vny/2, vny/2)
plt.plot(x, y, 'r-')
plt.show()
if __name__ == '__main__':
_plot_noise(15)
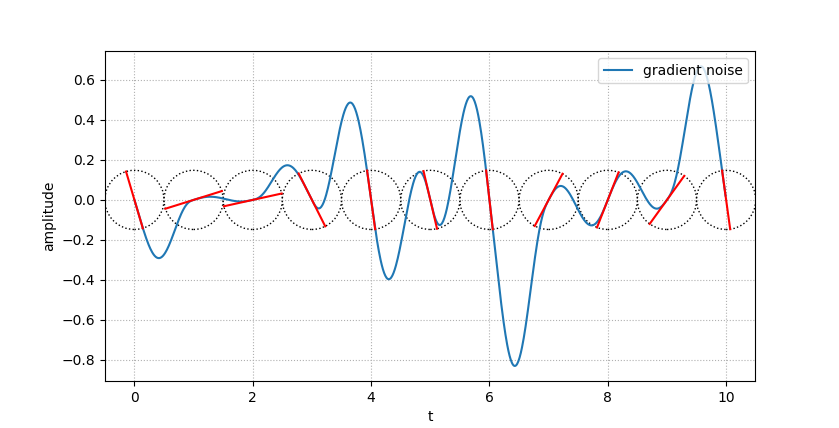
The red-lines drawing is located in the for-loop.
hypot(x[1]-x[0], y[1]-y[0]) gives me a constant .25 for every vector, which corresponds to my target length (¼). Which means my segments are actually in the correct length for the given aspect. This can also be “verified” with .set_aspect(1).
I’ve tried several things, such as translating the coordinates into display coordinates (plt.gca().transData.transform(...)), scale them, then back again (plt.gca().transData.inverted().transform(...)), without success (as if the aspect was applied on top of the display coordinates). Doing that would probably also actually change the angles as well anyway.
So to sum up: I’m looking for a way to display lines with a fixed length (expressed in the x data coordinates system), and oriented (rotated) in the xy data coordinates system.