Hello,
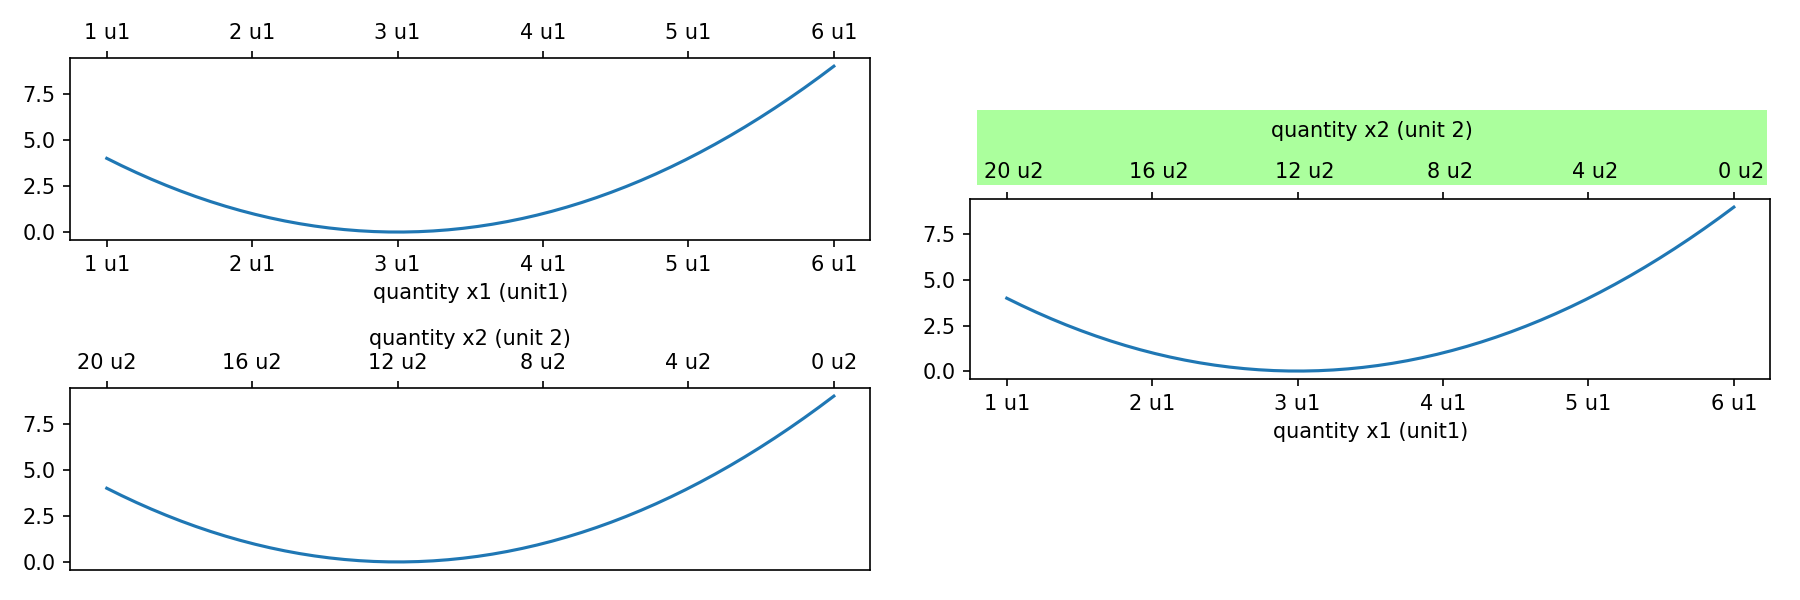
I'd like to know if it's possible to get a sort of double tick labeling
(e.g. bottom and top), but with different labels. One way to think of my
use case is that there are two different units for the x data (or more
precisely in my case, I've two different x quantities which are bound by
a linear relationship).
The result I'd like is the right part of the attached image (it's a
Gimp-edited mockup composition of the two actual plots on the left).
I've tried to play with the double labeling of a single axe. Indeed, the
following two calls put the double labeling
ax1.xaxis.set_ticks_position('both')
ax1.xaxis.set_tick_params(labeltop=True)
However, when I want to alter only the top labels using
for tick, l in zip(ax1.xaxis.get_major_ticks(), l2):
??? tick.set_label2(l)
I get no visible change on the plot. (full script attached). Did I need
to call some update ?
Did I miss something with the proper way to call Tick.set_label2?
Looking at the source code of ax1.xaxis.set_ticklabels, there is
something I don't get. First it sets a FixedFormatter(ticklabels), and
then it sets label1 and/or label2 for each Tick object. So in the end,
where is the text coming from?
Also, to complement the second series of tick labels, I'd like a second
axis label as well. However, I only know
ax.xaxis.set_label_position('top') to move xlabel to the top, not to get
a 2nd one...
As an alternative approach, I see twinx. I didn't try it yet, because I
feel like my objective is not of the objective of twinx (e.g. I'm
plotting only a single dataset, not two). However, I suspect it's
possible to 'bend" twinx to get what I want. What do you think.
Thank you in advance for your ideas.
Best,
Pierre
-------------- next part --------------
An HTML attachment was scrubbed...
URL: <http://mail.python.org/pipermail/matplotlib-users/attachments/20180425/4ff5cfd7/attachment-0001.html>
-------------- next part --------------
A non-text attachment was scrubbed...
Name: double_labels_mockup.png
Type: image/png
Size: 69026 bytes
Desc: not available
URL: <http://mail.python.org/pipermail/matplotlib-users/attachments/20180425/4ff5cfd7/attachment-0001.png>
-------------- next part --------------
A non-text attachment was scrubbed...
Name: DoubleTicksTest.py
Type: text/x-python
Size: 1211 bytes
Desc: not available
URL: <http://mail.python.org/pipermail/matplotlib-users/attachments/20180425/4ff5cfd7/attachment-0001.py>