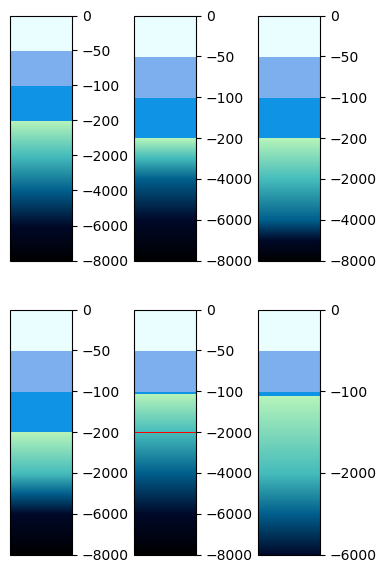
Currently, colorbar takes boundaries and values kwargs. If values is specified, len(values) must be len(boundaries)-1. values can be None. For either case the colorbar displays one color between 2 boundaries. This means colorbars for complex colormaps can be displayed incorrectly.
I’m working on what will eventually become a pull request:
(For more on inconsistent plotting of the red line, see the next post.)
If boundaries is specified and values is not, I uniformly space 1000 values between each set of boundaries to retrieve colors. 1000 is an arbitrary choice—can I make it less arbitrary?
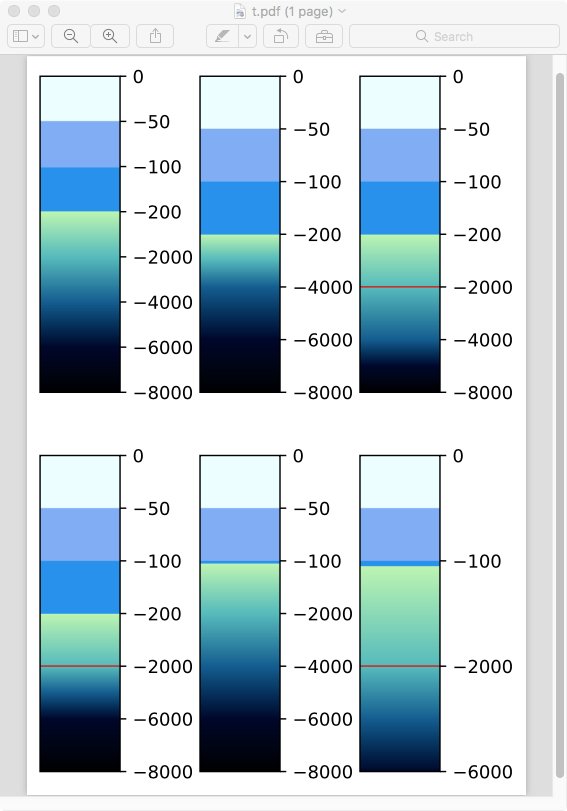
Re: the red line: whether or not it shows up in the colorbar depends on the backend. The above image is from PNG output; here is a screenshot of PDF output:
If boundaries is specified and values is not, I uniformly space 1000 values between each set of boundaries to retrieve colors. 1000 is an arbitrary choice—can I make it less arbitrary?
Re: the red line: whether or not it shows up in the colorbar depends on the backend. What’s going on?