Hi,
I want to display a cumulative distribution function (i.e. a function
going from 0 to 1) using a discrete colormap. That is, I want the
values from 0 to .1 to be mapped to one color, .1 to .2 to another
color and so on, so the quantiles can be seen at a glance. To do so, I
tried to discretize the existing color maps, for example, I tried
bone10 = matplotlib.colors.LinearSegmentedColormap(‘bone10’, cm._bone_data, 10)
and then plotted the matrix using
imshow(X, cmap = bone10)
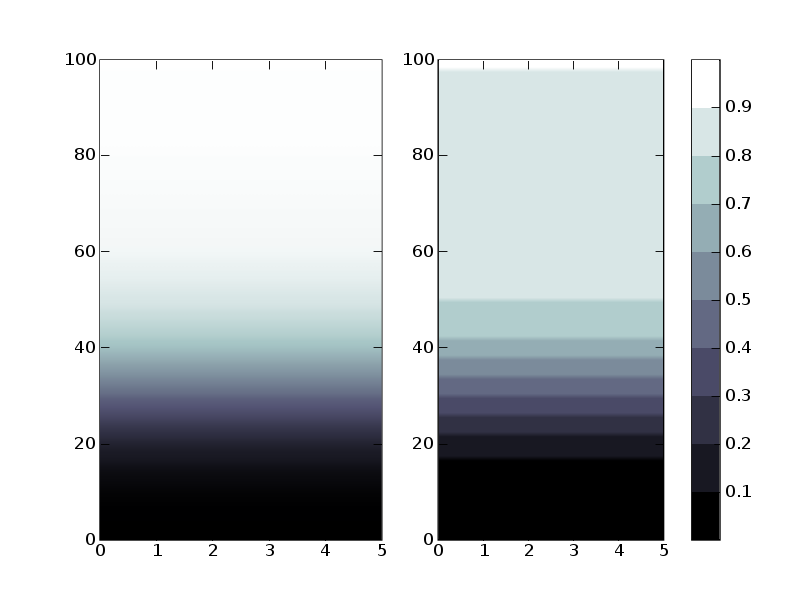
I included a figure showing on the left what I got using the standard
colormap bone and on the right what I obtain using bone10. As you can
see, the differences are important. The whole upper part of the
distribution is warped by the discrete colormapping. It seems that the
only values that are mapped to white are the values equal to 1. I
figured out this must be the quantization errors that the docstrings of
cm.bone warns about. My question is : is this the standard way to do
what I want and I’m not doing it properly, or it simply isn’t the
“right way”? Curiously, the colorbar displays the right behavior.
In short, should I define a new colormap from scratch, with anchors at
[0, .1, .2, …, .9, 1.] and the colorspace explicitely defined, or is
there a shortcut?
Thanks in advance for advice.
David
David,
It is possible that I made this discretization problem worse when I modified some of the color handling code. In any case, I would like to come up with one or more good, clean solutions, but I may need a few days. The problem is with the normalization (the norm kwarg), not the colormap, which is little more than a list of colors. The trick may be making sure any change in the norm code doesn't mess up the way contour and colorbar work.
One workaround is to calculate Xindex from X, where Xindex is an integer array the same size as X but containing the desired index into the colormap for each value of X, and then call
imshow(Xindex, cmap = bone10, norm = colors.no_norm)
I think this should work, but I haven't tried it yet.
Eric
David Huard wrote:
···
Hi,
I want to display a cumulative distribution function (i.e. a function going from 0 to 1) using a discrete colormap. That is, I want the values from 0 to .1 to be mapped to one color, .1 to .2 to another color and so on, so the quantiles can be seen at a glance. To do so, I tried to discretize the existing color maps, for example, I tried
bone10 = matplotlib.colors.LinearSegmentedColormap('bone10', cm._bone_data, 10)
and then plotted the matrix using
imshow(X, cmap = bone10)
I included a figure showing on the left what I got using the standard colormap bone and on the right what I obtain using bone10. As you can see, the differences are important. The whole upper part of the distribution is warped by the discrete colormapping. It seems that the only values that are mapped to white are the values equal to 1. I figured out this must be the quantization errors that the docstrings of cm.bone warns about. My question is : is this the standard way to do what I want and I'm not doing it properly, or it simply isn't the "right way"? Curiously, the colorbar displays the right behavior.
In short, should I define a new colormap from scratch, with anchors at [0, .1, .2, ..., .9, 1.] and the colorspace explicitely defined, or is there a shortcut?
Thanks in advance for advice.
David
------------------------------------------------------------------------
David,
Two more things:
1) Have you considered using contourf instead of imshow, or would it be inappropriate?
2) Please send me the code for the X array that you used in your example.
Thanks.
Eric
David Huard wrote:
Hi,
I want to display a cumulative distribution function (i.e. a function going from 0 to 1) using a discrete colormap. That is, I want the values from 0 to .1 to be mapped to one color, .1 to .2 to another color and so on, so the quantiles can be seen at a glance. To do so, I tried to discretize the existing color maps, for example, I tried
bone10 = matplotlib.colors.LinearSegmentedColormap('bone10', cm._bone_data, 10)
and then plotted the matrix using
imshow(X, cmap = bone10)
....