I often make graphs which have one “normal” subplot (e.g., a scatterplot) and another subplot which is a cartopy map.
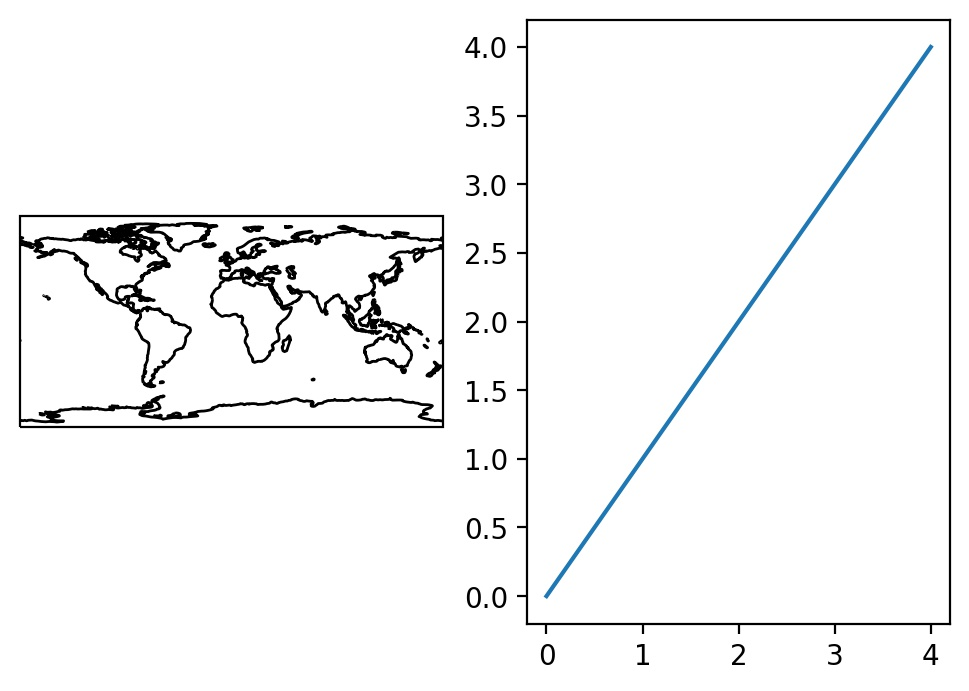
To do this, the easiest way I’ve found is to use subplot2grid(), however I have found that the subplots which are created are not of the same size! For example, see the example below, where the cartopy subplot is significantly smaller than the other subplot.
code:
import cartopy.crs as ccrs
import matplotlib.pyplot as plt

fig = plt.figure()

ax0 = plt.subplot2grid((1, 2), (0, 0), colspan=1, rowspan=1, projection=ccrs.PlateCarree())
ax1 = plt.subplot2grid((1, 2), (0, 1), colspan=1, rowspan=1)

ax0.coastlines()

ax1.plot(np.arange(5), np.arange(5))
output:
My current workaround is to make a subplot2grid() grid which has a very large dimension (e.g. 100 rows by 100 cols), and then I can force the subplots to be the same “size” by making the colspan and rowspan larger or smaller, but this is definitely not ideal.
Am I doing something wrong here? Is there a better workaround?
Thanks!
A