Hi,
I’ve a weird situation. I have a number of tests generating plots using pytest-mpl and if I run all tests then they pass…
❱ pytest -n15
===================================================================================================================================================== test session starts ======================================================================================================================================================
platform linux -- Python 3.10.8, pytest-7.2.0, pluggy-1.0.0
Matplotlib: 3.5.3
Freetype: 2.6.1
rootdir: /home/neil/work/projects/topostats/TopoStats, configfile: pyproject.toml, testpaths: tests
plugins: typeguard-2.13.3, regtest-1.5.0, xdist-2.5.0, anyio-3.6.1, mpl-0.16.1, cov-4.0.0, pylint-0.18.0, forked-1.4.0
gw0 [138] / gw1 [138] / gw2 [138] / gw3 [138] / gw4 [138] / gw5 [138] / gw6 [138] / gw7 [138] / gw8 [138] / gw9 [138] / gw10 [138] / gw11 [138] / gw12 [138] / gw13 [138] / gw14 [138]
..........................................................................................................................................                                                                                                                                                                               [100%]

---------- coverage: platform linux, python 3.10.8-final-0 -----------
Name                                Stmts   Miss  Cover
-------------------------------------------------------
topostats/filters.py                   97      7    93%
topostats/grains.py                   108      5    95%
topostats/grainstats.py               323     45    86%
topostats/io.py                        78     26    67%
topostats/logs/logs.py                 23      0   100%
topostats/plottingfuncs.py             83      4    95%
topostats/run_topostats.py            191     75    61%
topostats/theme.py                     30      1    97%
topostats/thresholds.py                31      0   100%
topostats/tracing/dnatracing.py       419    163    61%
topostats/tracing/skeletonize.py       27      0   100%
topostats/tracing/tracingfuncs.py     611    199    67%
topostats/utils.py                     79      5    94%
topostats/validation.py                13      6    54%
-------------------------------------------------------
TOTAL                                2113    536    75%

====================================================================== 138 passed in 42.35s ======================================================================
However, if I try and run tests on a single file many of the plots fail and its down to differences in the images…
❱ pytes tests/test_filters_minicircle.py
zsh: correct 'pytes' to 'pytest' [nyae]? y
====================================================================== test session starts =======================================================================
platform linux -- Python 3.10.8, pytest-7.2.0, pluggy-1.0.0
Matplotlib: 3.5.3
Freetype: 2.6.1
rootdir: /home/neil/work/projects/topostats/TopoStats, configfile: pyproject.toml
plugins: typeguard-2.13.3, regtest-1.5.0, xdist-2.5.0, anyio-3.6.1, mpl-0.16.1, cov-4.0.0, pylint-0.18.0, forked-1.4.0
collected 10 items

tests/test_filters_minicircle.py FF...FFFFF                                                                                                                                                                                                                                                                              [100%]

============================================================================ FAILURES ============================================================================
___________________________________________________________________________________________________________________________________________________ test_align_rows_unmasked ___________________________________________________________________________________________________________________________________________________
Error: Image files did not match.
  RMS Value: 2.7814330464109083
  Expected:
    /tmp/tmpaj0dyplq/test_filters_minicircle.test_align_rows_unmasked/baseline.png
  Actual:
    /tmp/tmpaj0dyplq/test_filters_minicircle.test_align_rows_unmasked/result.png
  Difference:
    /tmp/tmpaj0dyplq/test_filters_minicircle.test_align_rows_unmasked/result-failed-diff.png
  Tolerance:
    2
-------------------------------------------------------------------------------------- Captured log setup --------------------------------------------------------------------------------------
[Thu, 17 Nov 2022 10:42:46] [INFO    ] [topostats] Extracting image from .spm
[Thu, 17 Nov 2022 10:42:46] [INFO    ] [topostats] Loading image from : /home/neil/work/projects/topostats/TopoStats/tests/resources/minicircle.spm
[Thu, 17 Nov 2022 10:42:46] [INFO    ] [topostats] [minicircle] : Loaded image from : /home/neil/work/projects/topostats/TopoStats/tests/resources/minicircle.spm
[Thu, 17 Nov 2022 10:42:46] [INFO    ] [topostats] [minicircle] : Extracted channel Height
[Thu, 17 Nov 2022 10:42:46] [INFO    ] [topostats] [minicircle] : Pixel to nm scaling : 0.4940029296875
[Thu, 17 Nov 2022 10:42:46] [INFO    ] [topostats] [minicircle] : Masking disabled
[Thu, 17 Nov 2022 10:42:46] [INFO    ] [topostats] [minicircle] : Row and column medians calculated.
[Thu, 17 Nov 2022 10:42:46] [INFO    ] [topostats] [minicircle] : Median Row Height: 29.29087487488389
[Thu, 17 Nov 2022 10:42:46] [INFO    ] [topostats] [minicircle] : Rows aligned
-------------------------------------------------------------------------------------- Captured log setup --------------------------------------------------------------------------------------
Looking at the plots by eye they look pretty much identical.
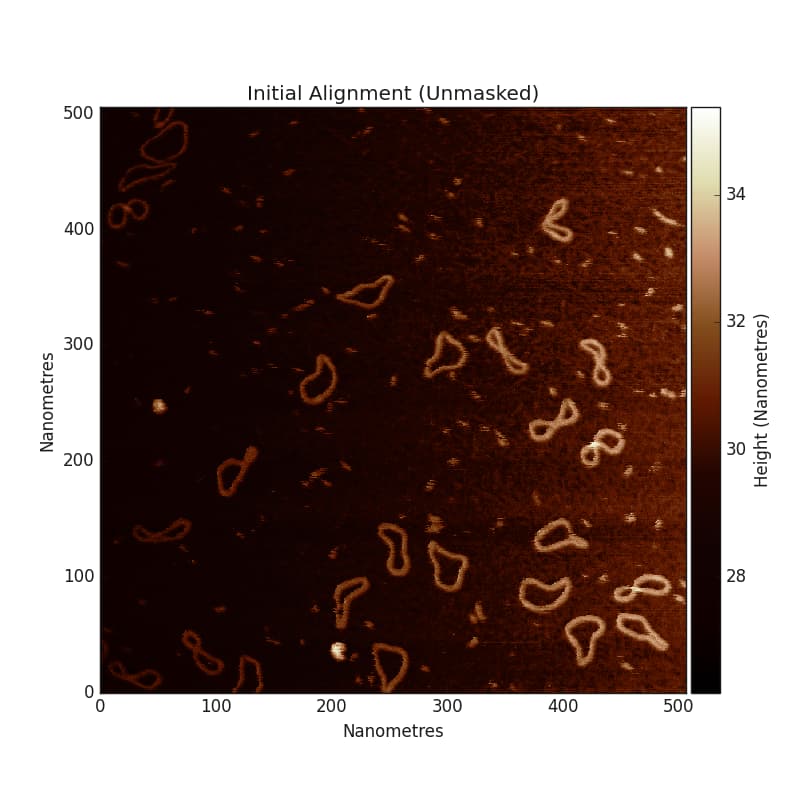

But the diff suggests they are in some manner different in the borders, axes, scales and labels
I can’t understand or see why this should be the case when just a subset of tests are run and its baffling. Its not a freetype font issue since its the same system, just different sets of tests being run.
Any pointers or thoughts on what might be causing this would be very much appreciated, its a bit of a pain running the whole test suite when developing individual tests for just one module.
EDIT : Adding version of matplotlib
Name: matplotlib
Version: 3.6.2
Summary: Python plotting package
Home-page: https://matplotlib.org
Author: John D. Hunter, Michael Droettboom
Author-email: matplotlib-users@python.org
License: PSF
Location: /home/neil/.virtualenvs/topostats-testpypi/lib/python3.10/site-packages
Requires: contourpy, cycler, fonttools, kiwisolver, numpy, packaging, pillow, pyparsing, python-dateutil
Required-by: pySPM, seaborn, topostats