Thanks to all Matplotlib experts for extending help,
With the suggestions I could make the script work and I am close to the target I had in mind,
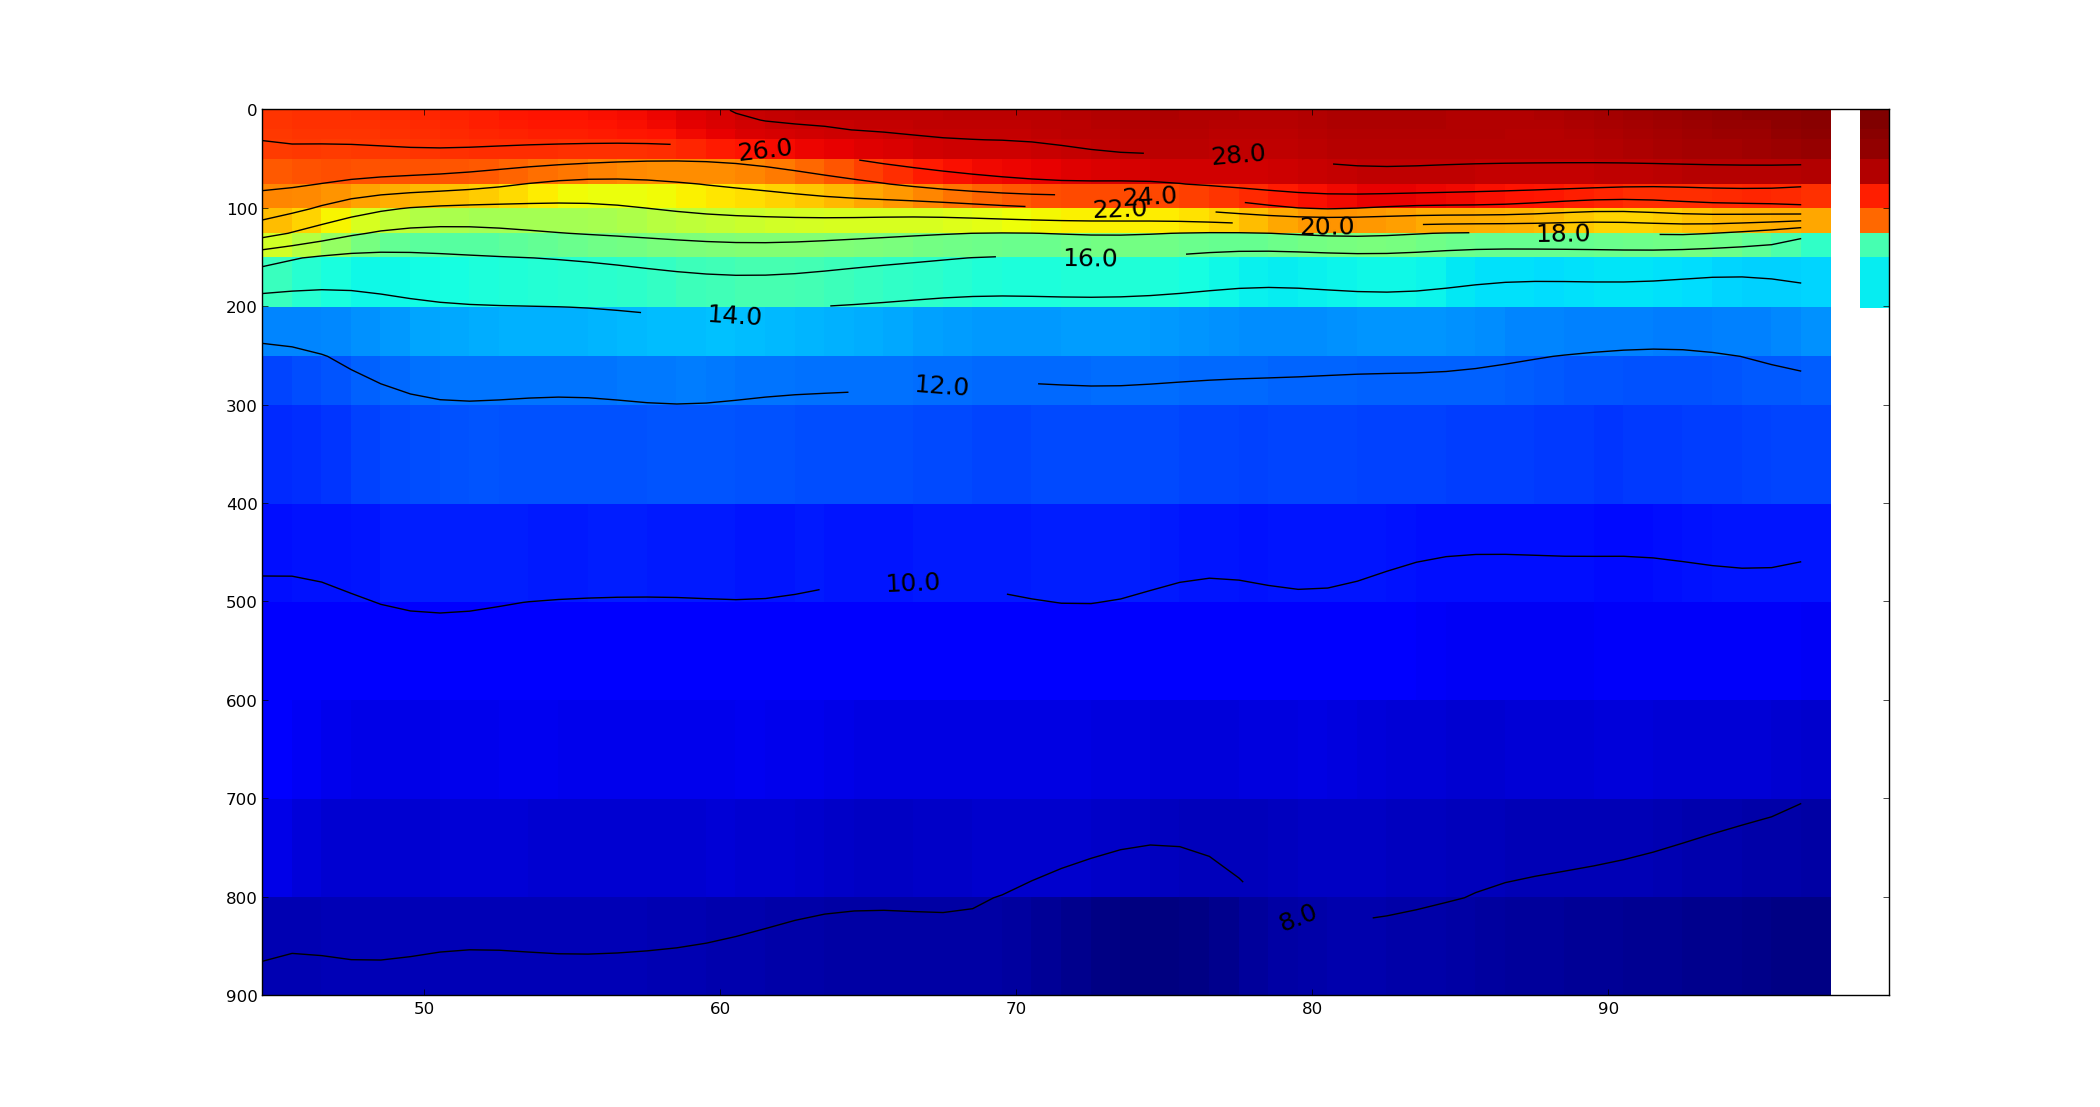
Below script produces as depth longitude contou-filled plot.
However I have below concerns,
-
There is a wide gap between label and the contours ie it appears like ------ 2.4 … is there a way to reduce this gap?
-
The labels are appearing cluttered at about 100m depth though they culd have spread apart at each level. Is there a way to control their placing to avoid cluttering?
-
Is there a way to make the longitude as in case of maps ie can the x axis labels be 50E 60E … 90E
I am not sure if I am too much ambitious with
regard to matplotlib, but I was using ferret where it takes care of the labeling.
with best regards,
Sudheer
from matplotlib import pyplot as plt
from netCDF4 import Dataset
import numpy as np
url=‘http://www.marine.csiro.au/dods/nph-dods/dods-data/climatology-netcdf/levitus_monthly_temp_98.nc’
ds = Dataset(url)
temp = ds.variables[‘TEMP’]
lats = ds.variables[‘lat’]
lons =
ds.variables[‘lon’]
depths = ds.variables[‘z’]
filter depths
dmin = np.where(depths[:] == 0.)[0][0]
dmax = np.where(depths[:] == 1000)[0][0]
filter all but one latitude
lat_index = np.where(lats[:] == 0.5)[0][0]
lats = lats[lat_index]
filter a range of longitudes
lon_lower_index = np.where(lons[:] == 44.5)[0][0]
lon_upper_index = np.where(lons[:] == 95.5)[0][0]
lons = lons[lon_lower_index:lon_upper_index]
depths=depths[dmin:dmax]
temp = temp[0,dmin:dmax, lat_index, lon_lower_index:lon_upper_index]
#plt.pcolormesh(lons,depths, temp)
nx,ny=np.meshgrid(lons,depths)
clevs=np.arange(temp.min(),temp.max()+2,temp.std()/5)
norm = plt.cm.colors.Normalize(vmax=abs(temp).max(), vmin=-abs(temp).max())
cmap =
plt.cm.gist_rainbow_r
plt.figure()
cs1=plt.contourf(nx,ny,temp, clevs,cmap=plt.cm.get_cmap(cmap, len(clevs)-1))
cs2=plt.contour(nx,ny,temp, cs1.levels,colors = ‘k’,linewidth=2,hold=‘on’)
plt.clabel(cs2,inline=True, fmt=‘%1.1f’, fontsize=18)
cb = plt.colorbar(cs1,pad=.02) #(location=‘right’)#,size=“5%”, pad=‘2%’)
plt.gca().invert_yaxis()
plt.show()
···
Sudheer Joseph
Indian National Centre for Ocean Information Services
Ministry of Earth Sciences, Govt. of India
POST BOX NO: 21, IDA Jeedeemetla
P.O.
Via Pragathi Nagar,Kukatpally, Hyderabad; Pin:5000 55
Tel:+91-40-23886047(O),Fax:+91-40-23895011(O),
Tel:+91-40-23044600(R),Tel:+91-40-9440832534(Mobile)
E-mail:sjo.India@…287…;sudheer.joseph@…9…
Web- http://oppamthadathil.tripod.com
From: Jody Klymak <jklymak@…1686…2…>
To: Sudheer Joseph <sudheer.joseph@…9…>
Cc: “[email protected]” [email protected]
Sent: Tuesday, 5 March 2013 2:10 AM
Subject: Re: [Matplotlib-users] depth longitude plot
Hi Sudheer,
You want contourf.
http://matplotlib.org/examples/pylab_examples/contour_image.html
Cheers, Jody
On Mar 4, 2013, at 9:04 AM, Sudheer Joseph <sudheer.joseph@…9…> wrote:
Hi Benamin,
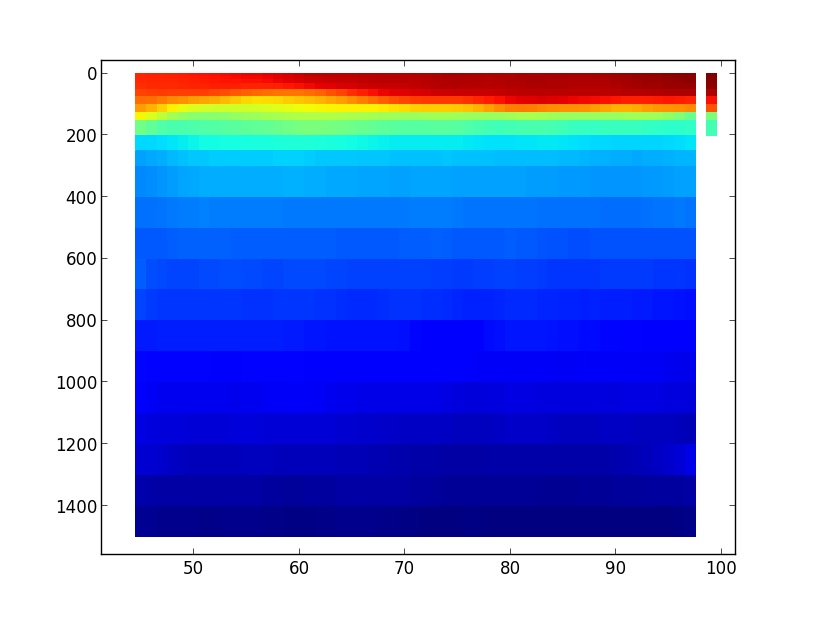
I was looking for a plot similar to the attached one named ferret.gif. But from matplot lib I get flat fill and contours which are not aligned to the levels ( named figure_1.png , it looks like matplotlib has just flat surfaces as it used pcolor.
with best regards,
Sudheer
From: Sudheer Joseph <sudheer.joseph@…9…>
To: Benjamin Root <ben.root@…1304…>
Cc: “[email protected]” <matplotlib-users@…1738…net>
Sent: Monday, 4 March 2013 8:19 PM
Subject: Re: [Matplotlib-users] depth longitude plot
Thank
you,
I just posted this question in numpy lists thinking that it is possible after regriding the data to new axes.
Thanks for the help.
with best
regards,
Sudheer
Sudheer Joseph
Indian National Centre for Ocean Information Services
Ministry of Earth Sciences, Govt. of India
POST BOX NO: 21, IDA Jeedeemetla P.O.
Via Pragathi Nagar,Kukatpally, Hyderabad; Pin:5000
55
Tel:+91-40-23886047(O),Fax:+91-40-23895011(O),
Tel:+91-40-23044600(R),Tel:+91-40-9440832534(Mobile)
E-mail:sjo.India@gmail.com;sudheer.joseph@…9…
Web- http://oppamthadathil.tripod.com
From: Benjamin Root <ben.root@…1304…>
To: Sudheer Joseph <sudheer.joseph@…9…>
Cc: Phil Elson <pelson.pub@…287…>; “[email protected]” [email protected]
Sent: Monday, 4
March 2013 7:53 PM
Subject: Re: [Matplotlib-users] depth longitude plot
On Sat, Mar 2, 2013 at 6:35 AM, Sudheer Joseph <sudheer.joseph@…9…> wrote:
Hi Phil,
Though iris looked to be promising it needed many other libraries, so I chose the below suggestion. But is there a way to overlay contours on this ? also is it possible to specify the levels?
In [23]: plt.pcolormesh?? did not give much help
with best regards,
Sudheer
You can overlay contours on the pcolormesh image by simply using the plt.contour() function after the pcolormesh() call. It allows you to control which levels to contour and you can specify the attributes of those contours like the color or thickness. Note that unlike Matlab, you don’t have to call “hold on” between plots. By default, matplotlib will hold.
I hope that helps!
Ben Root
Everyone hates slow websites. So do we.
Make your web apps faster with AppDynamics
Download AppDynamics Lite for free today:
http://p.sf.net/sfu/appdyn_d2d_feb
Matplotlib-users mailing list
[email protected]
https://lists.sourceforge.net/lists/listinfo/matplotlib-users
<ferret.gif><figure_1.png>------------------------------------------------------------------------------
Everyone hates slow websites. So do we.
Make your web apps faster with AppDynamics
Download AppDynamics Lite for free today:
http://p.sf.net/sfu/appdyn_d2d_feb_______________________________________________
Matplotlib-users mailing list
[email protected]
matplotlib-users List Signup and Options
–
Jody Klymak
http://web.uvic.ca/~jklymak/