Ok, I have code you can run below.
matplotlib 3.4.3: matplotlib-3.4.3-cp310-cp310-win_amd64.whl
matplotlib v3.6.0: matplotlib-3.6.0-cp310-cp310-win_amd64.whl
#Created on: Thur_Oct_20_14:13:22_2022
import numpy as np
import pandas as pd
import matplotlib as mpl
import matplotlib.pyplot as plt
from matplotlib.pyplot import figure
import matplotlib.gridspec as gridspec
from mpl_toolkits.axes_grid1 import host_subplot
from matplotlib.backends.backend_pdf import PdfPages
from matplotlib.ticker import (MultipleLocator, AutoMinorLocator, MaxNLocator)
import matplotlib.transforms as MT
from matplotlib.ticker import FormatStrFormatter
mpl.rcParams['axes.linewidth'] = .5
mpl.rcParams['lines.linewidth'] = 1
mpl.rcParams['patch.linewidth'] = .5
mpl.rcParams['legend.title_fontsize'] = 10
marker_style = dict (markersize = 5, markeredgecolor = '#000000', markevery = 1)
def custom_spine (isitfirst, orig_plt, cur_plot, fig, ylabel, ymin, ymax, yaxescount, fingraphs):
if isitfirst == True:
spineplot = orig_plt
spineplot.set_frame_on(True)
spineplot.patch.set_visible(False)
spineplot.set_ylabel (ylabel, labelpad = 5, fontsize = 5)
spineplot.grid(True,which = 'major', color = 'grey')
plt.xticks(fontsize = 5)
plt.yticks(fontsize = 5, va = 'center')
plt.figtext (.15, .06, 'Wed Oct 19 2022', va='baseline', ha='center', wrap=True)
plt.figtext (.15, .03, '18:22:43', va='baseline', ha='center', wrap=True)
plt.figtext (.35, .06, 'Python Version:', va='baseline', ha='center', wrap=True)
plt.figtext (.35, .03, '3.10.0', va='baseline', ha='center', wrap=True)
plt.figtext (.6, .06, 'Macro:', va='baseline', ha='center', wrap=True)
plt.figtext (.6, .03, 'test.py', va='baseline', ha='center', wrap=True)
spineplot.tick_params(axis='y', which='both', direction ='in', pad=5)
spineplot.tick_params(axis='x', which='both', direction ='in', pad=2)
elif isitfirst == False:
spineplot = cur_plot
yaxespos = (yaxescount*-0.09)
spineplot.spines['right'].set_position(('axes', yaxespos))
spineplot.yaxis.tick_right()
spineplot.set_ylabel (ylabel, labelpad = -40, fontsize = 5)
spineplot.tick_params (axis ='y', direction = 'out')
plt.setp(spineplot.get_yticklabels(), fontsize = 5, ha = 'right')
dx = 10/72.; dy = 0/72.
offset = MT.ScaledTranslation(dx, dy, fig.dpi_scale_trans)
for label in spineplot.get_yticklabels():
label.set_transform(label.get_transform() - offset)
else:
spineplot = cur_plot
spineplot.axes.get_yaxis().set_visible(False)
if yaxescount != []:
leftloc = (0.10 +(0.05*yaxescount))
plt.subplots_adjust(left = leftloc, right = 0.90, bottom = 0.15)
if fingraphs == True:
spineplot.yaxis.set_major_locator(MultipleLocator(5))
spineplot.set_ylabel (ylabel, labelpad = 5, fontsize = 10)
else:
increment = (ymax-ymin)/10
spineplot.yaxis.set_ticks(np.arange(ymin, ymax*1.000001, increment))
spineplot.set_ylim(ymin, ymax)
spineplot.yaxis.set_minor_locator(AutoMinorLocator(10))
spineplot.xaxis.set_minor_locator(AutoMinorLocator(10))
spineplot.yaxis.set_major_formatter(FormatStrFormatter('%.1f'))
spineplot.tick_params(axis='x', which='both', direction ='in', pad=2)
return spineplot
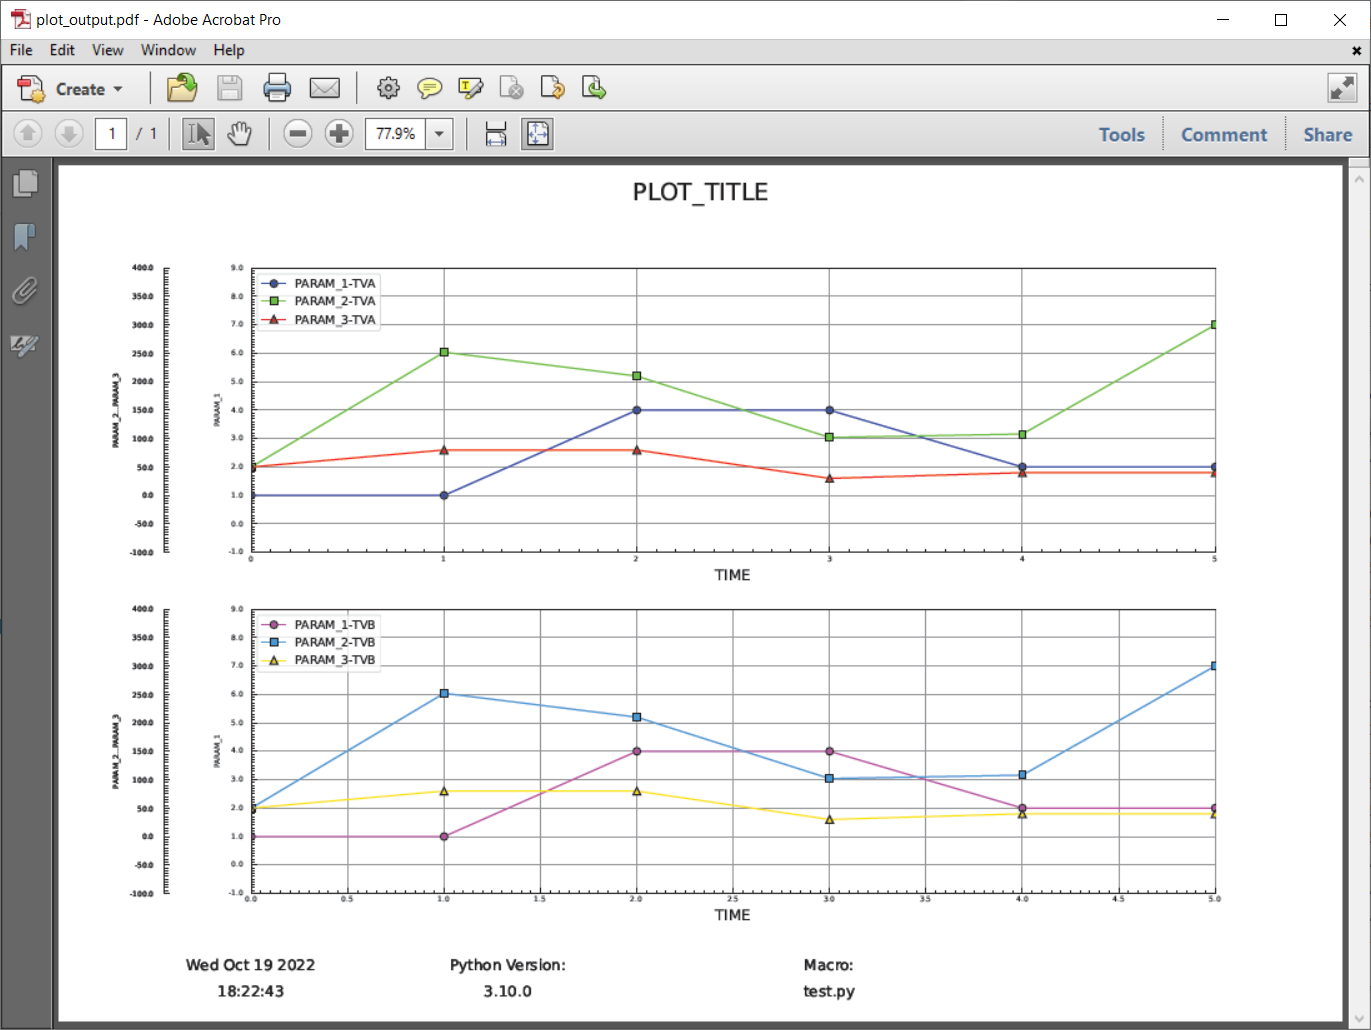
pp = PdfPages('plot_output.pdf')
fig1= plt.figure (1, figsize = (12,8))
gs = gridspec.GridSpec(nrows=2, ncols=1)
fig1.suptitle('PLOT_TITLE', fontsize = 16)
plot1 = host_subplot (gs[0])
plot1.set_xlabel ('TIME')
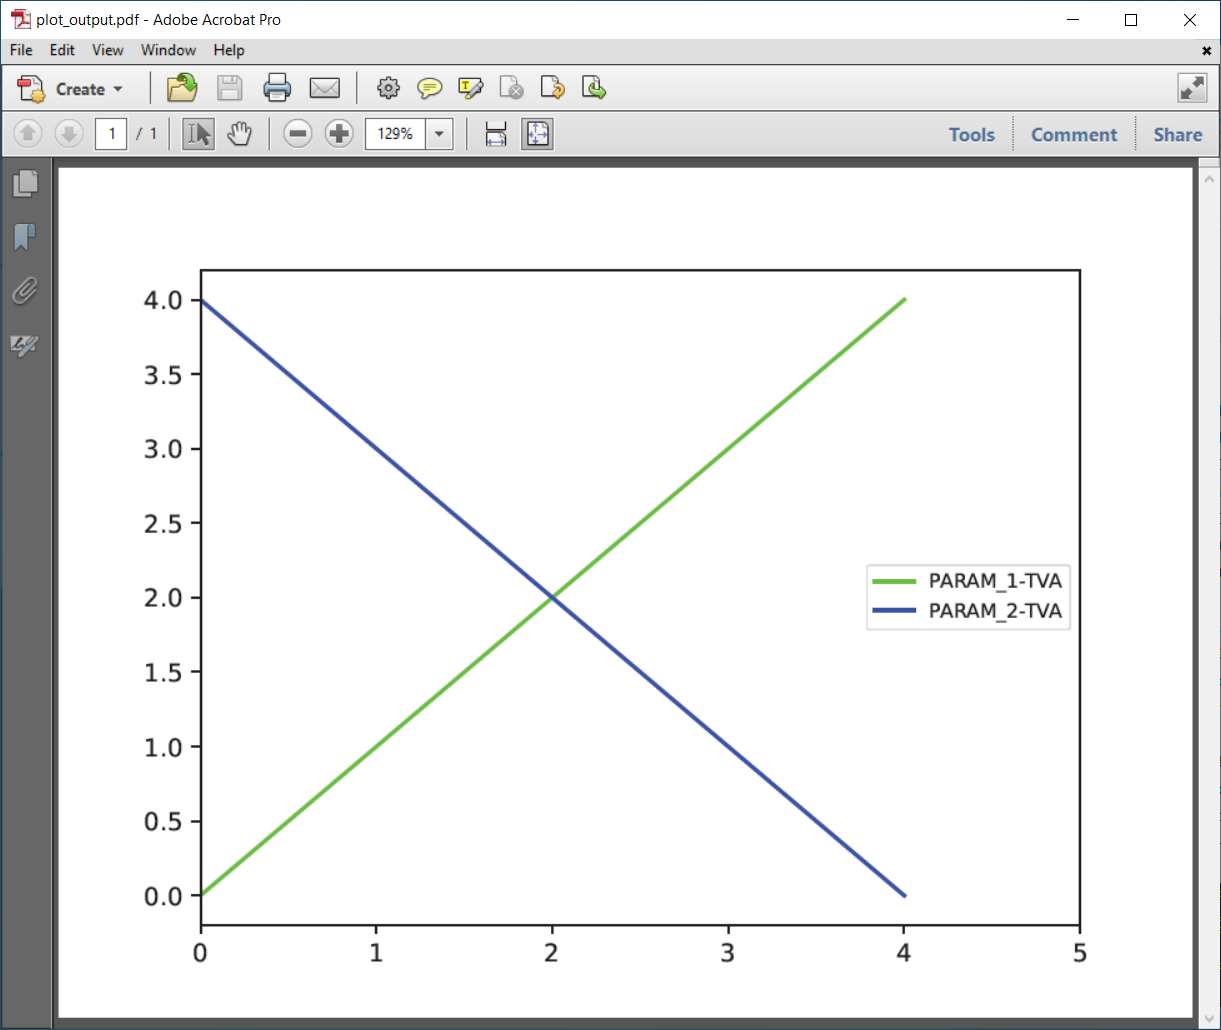
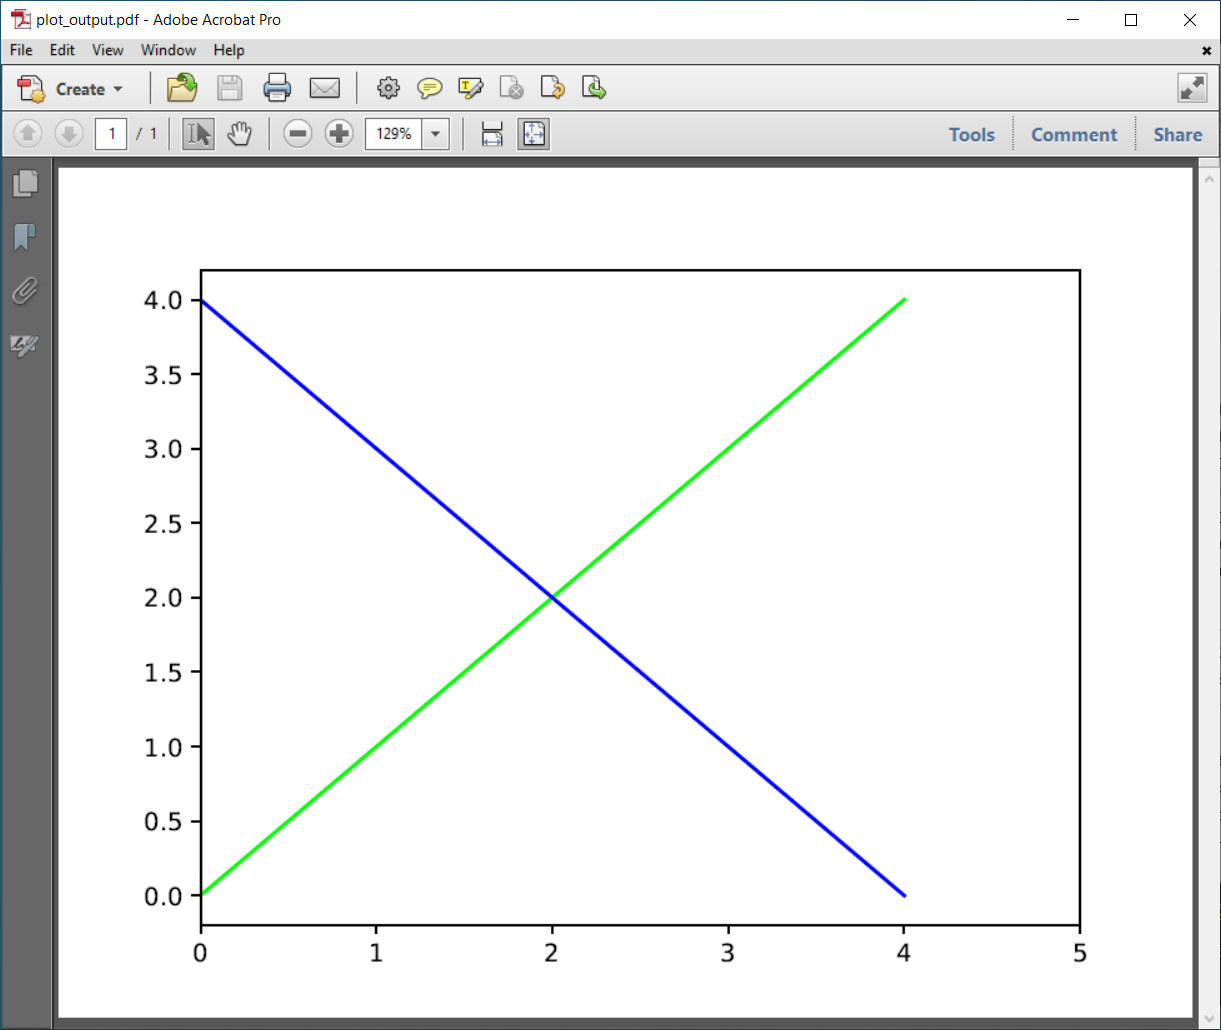
plot1.plot ([0, 1, 2, 3, 4, 5], [1, 1, 4, 4, 2, 2], label = 'PARAM_1-TVA', color ='#0000FF', marker = 'o', **marker_style)
plot1 = custom_spine (True, plot1 , plot1, fig1, 'PARAM_1', -1, 9, 0, False)
plot1b = plot1.twinx()
plot1b.plot ([0, 1, 2, 3, 4, 5], [50, 252, 210, 102, 108, 300], label = 'PARAM_2-TVA', color ='#00FF00', marker = 's', **marker_style)
plot1b = custom_spine (False, plot1, plot1b, fig1, 'PARAM_2...PARAM_3', -100, 400, 1, False)
plot1c = plot1.twinx()
plot1c.plot ([0, 1, 2, 3, 4, 5], [50, 80, 80, 30, 40, 40], label = 'PARAM_3-TVA', color ='#FF0000', marker = '^', **marker_style)
plot1c = custom_spine (False, plot1, plot1c, fig1, 'PARAM_2...PARAM_3', -100, 400, 1, False)
plot1.legend (loc = 'best', bbox_to_anchor=(0,0,1,1), bbox_transform=plot1.transAxes, fontsize=8)
plot1.set_xlim(0,5)
plot2 = host_subplot (gs[1])
plot2.set_xlabel ('TIME')
plot2.plot ([0, 1, 2, 3, 4, 5], [1, 1, 4, 4, 2, 2], label = 'PARAM_1-TVB', color ='#FF00FF', marker = 'o', **marker_style)
plot2 = custom_spine (True, plot2 , plot2, fig1, 'PARAM_1', -1, 9, 0, False)
plot2b = plot2.twinx()
plot2b.plot ([0, 1, 2, 3, 4, 5], [50, 252, 210, 102, 108, 300], label = 'PARAM_2-TVB', color ='#009FFF', marker = 's', **marker_style)
plot2b = custom_spine (False, plot2, plot2b, fig1, 'PARAM_2...PARAM_3', -100, 400, 1, False)
plot2c = plot2.twinx()
plot2c.plot ([0, 1, 2, 3, 4, 5], [50, 80, 80, 30, 40, 40], label = 'PARAM_3-TVB', color ='#FFDF00', marker = '^', **marker_style)
plot2c = custom_spine (False, plot2, plot2c, fig1, 'PARAM_2...PARAM_3', -100, 400, 1, False)
plot2.legend (loc = 'best', bbox_to_anchor=(0,0,1,1), bbox_transform=plot2.transAxes, fontsize=8)
plot2.set_xlim(0,5)
plt.locator_params(axis='x', nbins=12)
pp.savefig(fig1)
pp.close()