Hi all,
I ran into a problem where I wanted to plot a step-plot with dashed lines instead of solid lines which can be important for print media. This isn't possible with the current matplotlib version, so I added support for this. The patch is attached, but I didn't commit it yet since I wanted to ask for feedback first. It basically adds support to do
pylab.plot(x, y, 'steps--')
to create a step plot with dashed lines.
mm
dashedsteps.patch (2.36 KB)
Manuel Metz wrote:
Hi all,
I ran into a problem where I wanted to plot a step-plot with dashed lines instead of solid lines which can be important for print media. This isn't possible with the current matplotlib version, so I added support for this. The patch is attached, but I didn't commit it yet since I wanted to ask for feedback first. It basically adds support to do
pylab.plot(x, y, 'steps--')
to create a step plot with dashed lines.
Hm, okay - I just noticed that the patch doesn't work with legend. This needs to be fixed ...
mm
Hi all,
I think I have finally found a nice way to implement step-plots with
different linestyles. The way this is done required some re-writing of
lines.py, but I think it is done in a consistent manner:
A new property *drawstyle* is introduced. By default this just
connects the datapoints by a straight line. It can be set to "steps-***"
to create step-plots. So, the important point is that "steps-***" is no
longer a linestyle and thus it is possible to set the linestyle
independently. Additionally one can set a combined line- and drawstyle,
e.g. linestyle='steps-mid:'.
The drawstyle property has the advantage, that one can add other ways
to draw the data naturally, for example one can think of a drawstyle
"bspline" that connects data-points using a spline, or something like a
moving-mean plot.
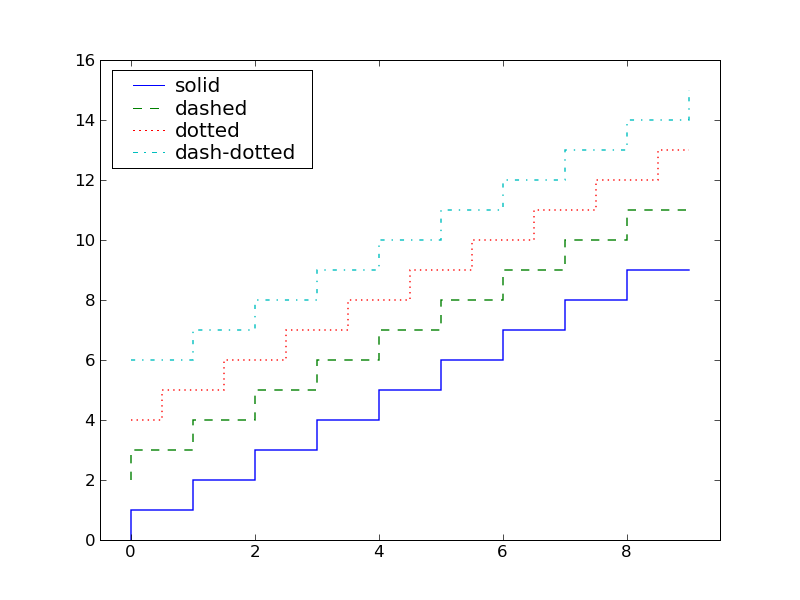
The patch is applied and also an example and its output. If there are
no objections, I will commit the patch soon.
Any comments ???
Manuel
lines_drawstyle.patch (7.11 KB)
steps.py (346 Bytes)