Custom plot function in Jupyter notebooks

I have a question that is related to both Matplotlib and Jupyter notebooks, so I’m not even sure this is the right place to ask (so if not just let me know).

Let’s say that I have a custom plot function which generates a complicated plot in a Figure (so in general it consists of multiple Axes). Now according to the documentation, the preferred function signature includes an Axis argument, and the function returns some collection of objects that have changed:

def my_plotter(ax, data1, data2, param_dict):
    """
    A helper function to make a graph.
    """
    out = ax.plot(data1, data2, **param_dict)
    return out

However, I am not sure how to implement this pattern when my figure consists of several Axes. Currently, my function returns the whole Figure, because this makes it easy for users to modify it later. Therefore, a minimal example for my function looks like this:

import matplotlib.pyplot as plt

def plot_fig():
    fig, ax = plt.subplots()
    ax.plot(1)
    return fig

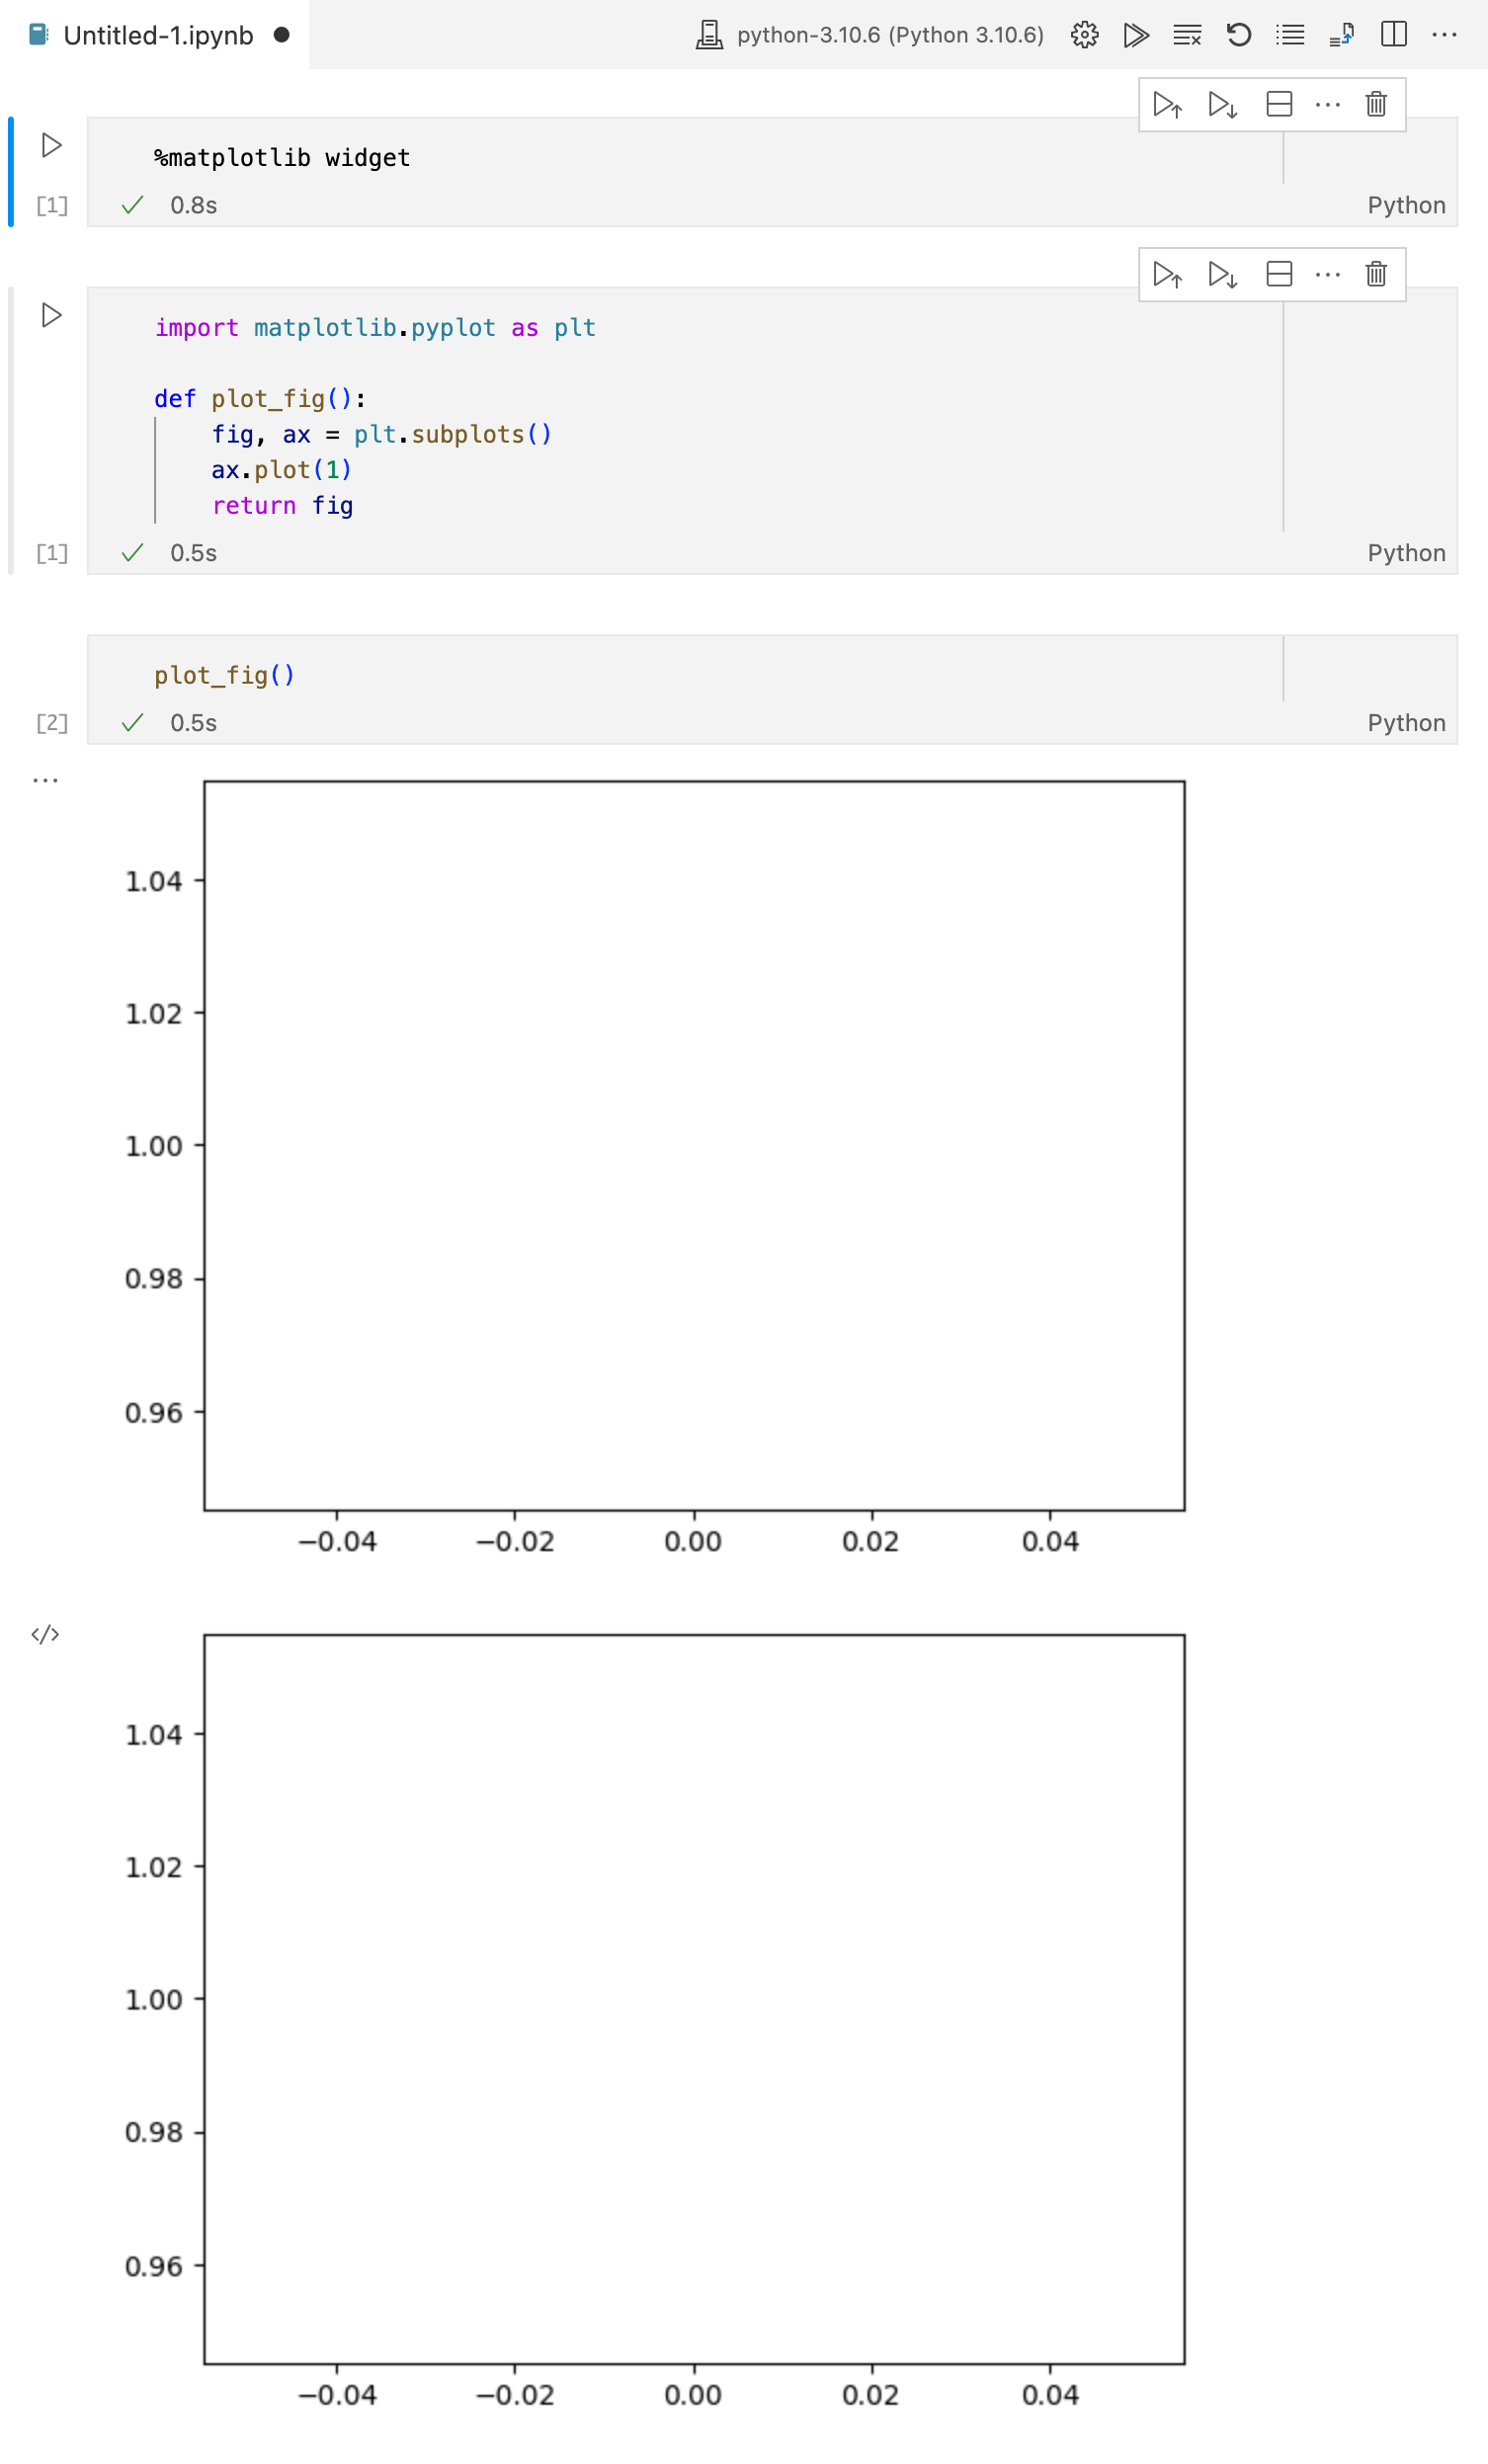
This works fine in most cases, but there is a problem when using this function in a Jupyter notebook – it produces two plots instead of one:

plot_fig()

It doesn’t matter if the backend is the default static one or the widget one, there are always two plots:

It seems like one output is generated by the function, and the other by the object’s repr(), or rather _repr_html_() method. I could “fix” this simple example as follows (and yes, this kind of monkey-patching is pretty ugly):

def plot_fig_repr():
    fig, ax = plt.subplots()
    ax.plot(1)
    fig._repr_html_ = lambda self=fig: ""
    return fig

Another “fix” would be to tell users to assign a name to the function call, but I don’t want this special-casing either:

_ = plot_fig()

Is this the way to go (i.e. expected behavior)? Or are there better alternatives and/or best practices on how to write such custom plotting functions (i.e. instead of returning a Figure)? Or is this an issue with Jupyter (and not Matplotlib)?

Thank you for your help!

2 Likes

When a fig is the last thing in a jupyter cell it will always be rendered. So one way to avoid this double rendering is to assign it to a variable instead. complex_fig = plot_fig() and then you will only have one figure.

A second option is to ensure that the figure is not shown unless the user who called it explicitly asks for it (i.e. by having it be the last thing in a cell). To accomplish this you need to prevent the figure being shown automatically. You can do this using ioff() like so:

def plot_fig():
    with plt.ioff():
        fig, ax = plt.subplots()
    ax.plot(1)
    return fig

and you can add some configurability as will if you want

def plot_fig(show=False):
    with plt.ioff():
        fig, ax = plt.subplots()
    ax.plot(1)
    if show:
        plt.show(fig)
    return fig

Thank you for your suggestions @ianhi!

I know that I can suppress the figure by assigning the function call to a name, but I do not want to do that. In my opinion, users should just be able to call the plotting function and get one plot, just like plt.plot(data).

Regarding the second option, we already have a show parameter, but this is very confusing in a notebook. If show=True, there are two figures. If show=False, there is still one figure. I’d expect the former to show one figure and the latter to show no figure at all.

Fair enough. You can probably set up some logic if you also check whether you are in one the notebook backends:

def notebook_backend():
    """
    returns True if the backend is ipympl or nbagg, otherwise False
    """
    backend = get_backend().lower()
    if "ipympl" in backend:
        return True
    elif backend == "nbAgg".lower():
        return True
    return False

Thanks, this might be worth a shot. Treating a notebook differently might be a good option.

But coming back to my initial question, do you thing returning a Figure is OK? Packages rarely do this and return some other object (like a grid, artists, collection) instead.

I think returning a figure is fine if that’s the most useful object for users. You could also consider doing return fig, axs if you htink having both would be useful - I do that in mpl-interactions (mpl-interactions/generic.py at fec5a943ca3cf702023c199a69bf91c4cf61c4dd · ianhi/mpl-interactions · GitHub)

In general i’d say return whatever you want so long as it is well documented. It just so happens that for most 3rd party matplotlib libraries returing an ax is the most reasonable thing,

1 Like

You are correct that the second plot in the repr. I thought that there was some logic in matplotlib-inline and ipympl to try and prevent exactly this case, but apparently not (or it has broken).

The other fix is to do

my_plotter();

which will prevent the repr from being shown.

Interesting. What would be the best place to investigate? I also think that the current behavior is broken, and it would be great if that could be fixed (then returning a figure would not automatically render it).

Thanks also for the other suggestions, returning fig, axs is a good idea, but for existing code this would mean breaking backward compatibility. A trailing ; is pretty ugly, we’re not writing MATLAB :smile: – but yeah, it’s a workaround.

The things that are colliding here:

  • in plt.ion() mode when you create a figure it is implicitly shown (which in a notebook means it gets put in the output of the notebook somehow). This is good because it matches the behavior of terminal usage and reduces the ceremony required to get plots in front of eye balls (if we always required user action here we would have a stream of issues demanding that the showing be automatic). If you do plt.ioff() you might get some improvement in some cases, but then if the user ever did not put your function last they would have to do something manual to see the figure.
  • there is a __repr_html__ associated with matplotlib.figure.Figure (which is registered on the jupyter side) which is a static snapshot of the figure. This makes good sense and is very helpful if you want to keep using a single figure and inject multiple snapshots of it into the notebook. I do not think this behavior can be removed.
  • The last unbound value in a notebook input cell is repred into the output (unless suppressed via ;). Again, this is not something we can changed.
  • your function returns just a Figure object and is frequently the last unbound function in a cell.

Of those things I think each of them alone is reasonable and correct (and relied on by many people), but they interact in ways that are deeply inconvenient for you.

Relevant documentation and issue:

This to me is the strangest one, and feels somewhat broken. Quoting from the GitHub issue where this discussion with @cbrnr began (with some implied context added in [brackets]):

It is informative to define _repr_html_ [for the custom figure object] as something like print("foo") and to play around with a notebook using %matplotlib ipympl. You’ll see that [if your custom figure object is the last item in the cell] you get one output that is interactive, and another one that is a static PNG.

I guess you could still say “there are workarounds”. But to me getting 2 plots (one static, one interactive) suggests that there is a conflict that needs to be resolved. @tacaswell do you think it’s worth raising this upstream? If so where would be the right place? You say that the __repr_html__ associated with MPL Figures is “registered on the Jupyter side”, but I’m not sure I understand the implications of that as far as where the relevant bits of code are that would need to change.

Thanks @tacaswell for the detailed explanation! This gives me a better idea of the different components interacting here.

Regarding the _repr_html_ issue that @drammock is mentioning, I guess the idea is to be able to get a plot by just typing fig, which is of course very convenient. The problem arises when you both create the plot and also type fig (implicitly), which then gives two plots. To me, more or less the only solution is to not return a Figure, but this is not possible in many cases such as ours, where we would break a lot of code.

The _html_repr_ that is interactive in ipympl is on fig.canvas (because that is the thing that knows about js (and in the desktop case Qt, Wx, …)). The logical split is Figure is a definitively user-facing thing that is aware of Matplotlib things, but is naive to any of the details of the backend or the UI toolkit it may (or may not) be embedded in. On the other hand the Canvas is public, but most users do not have to know about it thing that is all about the backend (it knows how to make the renderer that is used to render the actual output) and is where all of the UI related logic lives.

The code that does the registering is at:

The other code for de-duplication is in the inline backend it the show method, but on a bit more consideration I suspect there may be an inherent ordering issue in that the logic in show (where we can safely de-duplicate) fires before the implicit repr logic but after the explicit display(fig) logic (and this is the case we can de-duplicate). That is a combination of a guess and a vague memory, please fact-check me on this if you are going to rely on this statement!

Unfortunately given the number of things that can not change, I think the least bad path is to document your users either need to capture the return (which they probably want to do anyway so they can do fig.savefig(...) etc) or to use the trailing ; to suppress the repr in the notebook.

2 Likes