Not a bug report but I didn’t know where I should ask this. Please do not hesitate to tell me where I should ask such a question.
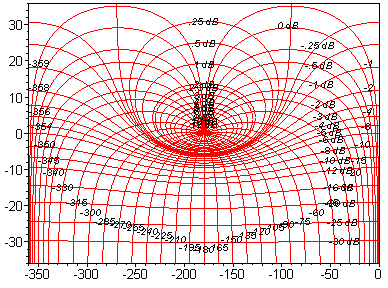
I would like to make my own “grid” system for a “black” - like chart :

could you give me a starting point from that; some advice ? What object I should inheritate from to customize it for example ?
Thanks a lot,
Mike
I’m a bit unclear on what you want to do.
Are you trying to plot that exact system of line? In which case you’d have to calculate what you want and plot them like usual lines.
Are you trying to make a plot that uses a kind of custom projection? So that, e.g., you can put a scatter point at (0, 0) which would end up at the crossing of the line going up at the top right.
There are a couple examples of the latter:
https://matplotlib.org/gallery/misc/custom_projection.html
https://matplotlib.org/gallery/specialty_plots/skewt.html
Not something as complex as custom projection. More a kind of “background” (like a grid) showing specific informations and trajectories. Simply plotting curves can appear in the legend and I do not want that for this “custom grid”.
I believe with “patch” or “artist” I can manage this.
Thanks for your answer,
Mike
If you want to hide an Artist from the legend, you can give it an underscore-prefixed label, ax.plot(..., label='_invisible').
Very Nice dear Quantum Analyst ! exactly what I required !
Thanks a lot,
Mike
