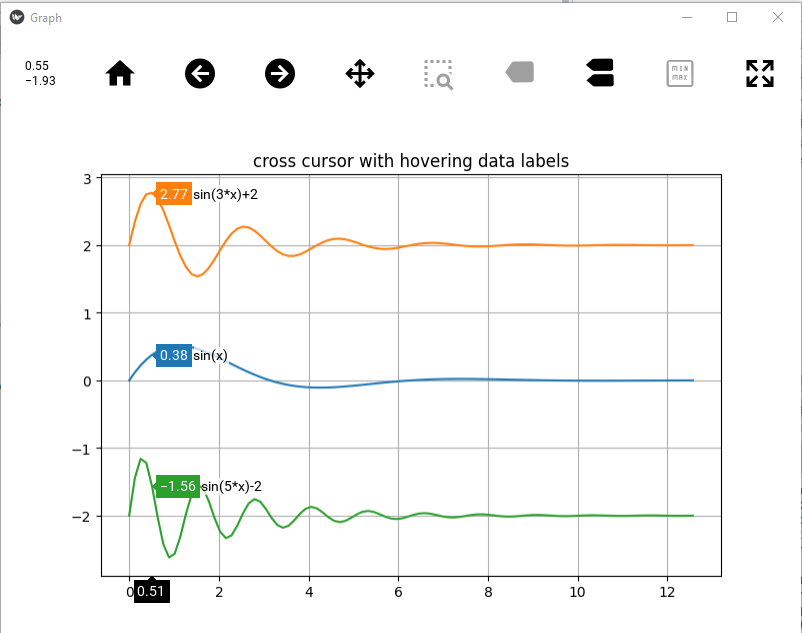
Base on this popular showcase topics, you can create a compare hover by adding 2 lines in your code. The hover is built in kivy (no matplotlib draw), so it will be faster with big data.
import matplotlib.pyplot as plt
import numpy as np
from kivy_matplotlib_widget.tools.interactive_converter import interactive_graph_ipython

x = np.linspace(0, 4.*np.pi,100)

p = np.exp(-x / 2.) * np.sin(x)
q = np.exp(-x / 2.) * np.sin(3*x) + 2
r = np.exp(-x / 2.) * np.sin(5*x) - 2

fig, ax = plt.subplots(figsize=(6, 6))
ax.plot(x, p, )
ax.plot(x, q, )
ax.plot(x, r, )
ax.set_title("cross cursor with hovering data labels")
ax.grid()

l_labels = ['sin(x)','sin(3*x)+2','sin(5*x)-2']
for ii, aax in enumerate(ax.lines):
    aax.set_label(l_labels[ii])

interactive_graph_ipython(fig,compare_hover=True)