I have develop a kivy package for creating interactive graph with matplotlib.
This package include several useful tools to interact with your data. Here a list of some key features
zoom with 2 fingers or mouse scroll
pan with 1 finger or mouse left click
zoom box like plotly library
reset axis on double-click (home button)
fast rendering mode (axis not updated for faster draw)
use only 2 packages (kivy + matplotlib) and no additional backend
matplotlib cursor and kivy hover option (touch or desktop mode)
legend widget like plotly library
interactive axis like plotly library
min/max touch option to easily change axis limit
autoscale option
several selectors widget (rectangle, lasso, ellipse and span)
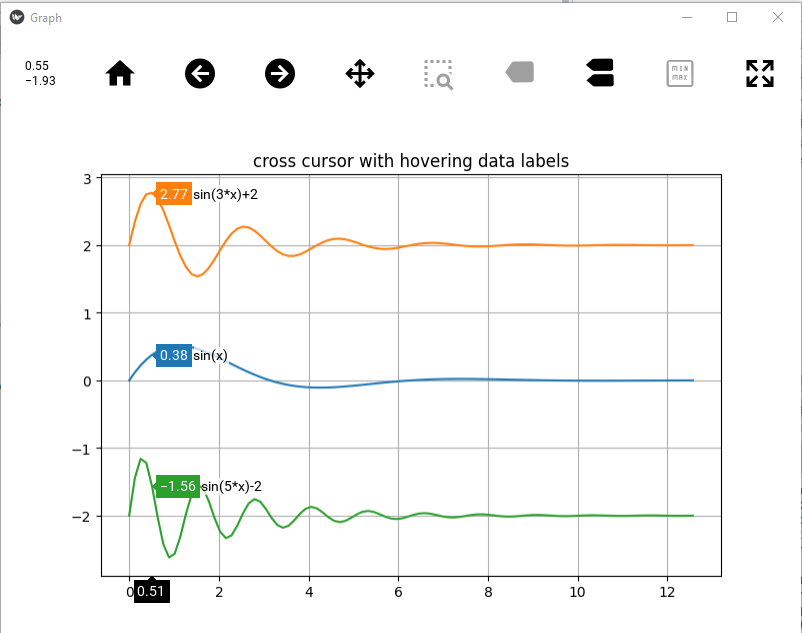
Base on this popular showcase topics, you can create a compare hover by adding 2 lines in your code. The hover is built in kivy (no matplotlib draw), so it will be faster with big data.
import matplotlib.pyplot as plt
import numpy as np
from kivy_matplotlib_widget.tools.interactive_converter import interactive_graph_ipython

x = np.linspace(0, 4.*np.pi,100)

p = np.exp(-x / 2.) * np.sin(x)
q = np.exp(-x / 2.) * np.sin(3*x) + 2
r = np.exp(-x / 2.) * np.sin(5*x) - 2

fig, ax = plt.subplots(figsize=(6, 6))
ax.plot(x, p, )
ax.plot(x, q, )
ax.plot(x, r, )
ax.set_title("cross cursor with hovering data labels")
ax.grid()

l_labels = ['sin(x)','sin(3*x)+2','sin(5*x)-2']
for ii, aax in enumerate(ax.lines):
    aax.set_label(l_labels[ii])

interactive_graph_ipython(fig,compare_hover=True)