See examples/broken_barh.py (this also allows breaks in the horizontal
bars, eg if an event is interrupted and then resumes). I haven't
added gradient fills on bars because I don't think they convey little
if any information but just add to the glitz factor (an example of
"chart junk" to use Tufte's phrase) but at some point we should bow to
popular pressure and add it. Actually, you can hack gradient filled
bars and axes backgrounds -- be careful, viewing the figure below may
induce seizures.
from pylab import figure, show, nx, cm
def gbar(ax, x, y, width=0.5, bottom=0):
X = [[.6, .6],[.7,.7]]
for left,top in zip(x, y):
right = left+width
ax.imshow(X, interpolation='bicubic', cmap=cm.Blues,
extent=(left, right, bottom, top), alpha=1)
fig = figure()
xmin, xmax = xlim = 0,10
ymin, ymax = ylim = 0,1
ax = fig.add_subplot(111, xlim=xlim, ylim=ylim,
autoscale_on=False)
X = [[.6, .6],[.7,.7]]
ax.imshow(X, interpolation='bicubic', cmap=cm.copper,
extent=(xmin, xmax, ymin, ymax), alpha=1)
N = 10
x = nx.arange(N)+0.25
y = nx.mlab.rand(N)
gbar(ax, x, y, width=0.7)
ax.set_aspect('normal')
show()
···
On 9/20/07, Ryan Krauss <[email protected]...> wrote:
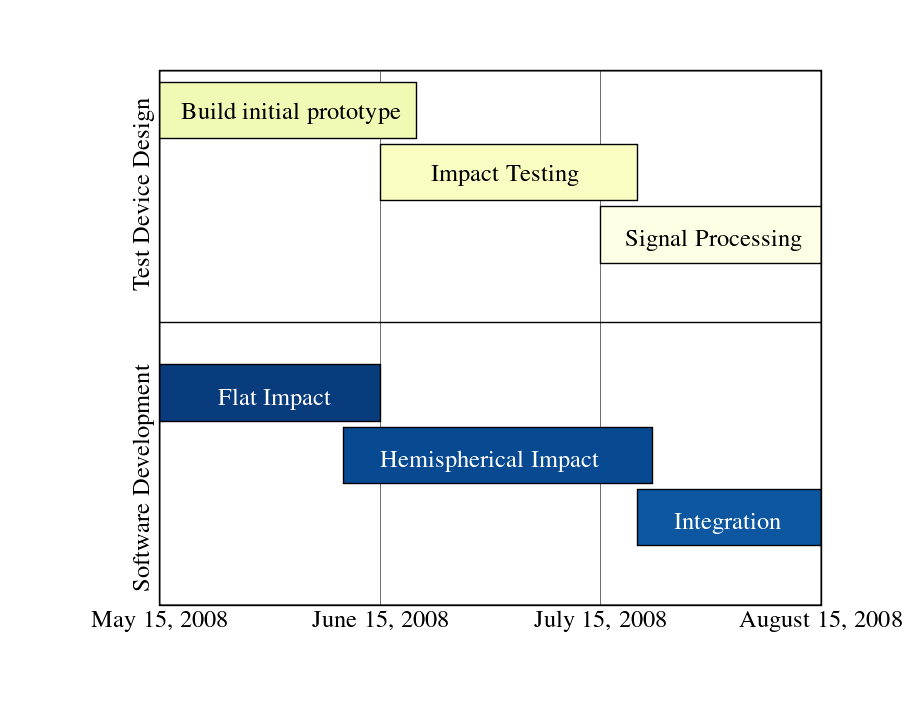
I would need to create a timeline for a Latex document (eps output).
There may be other tools besides Matplotlib and I am open to
suggestions. But I were going to use mpl, what would it take to do
something along these lines:
http://www.timelinemaker.com/product-samplecharts-constructiontimeline.html
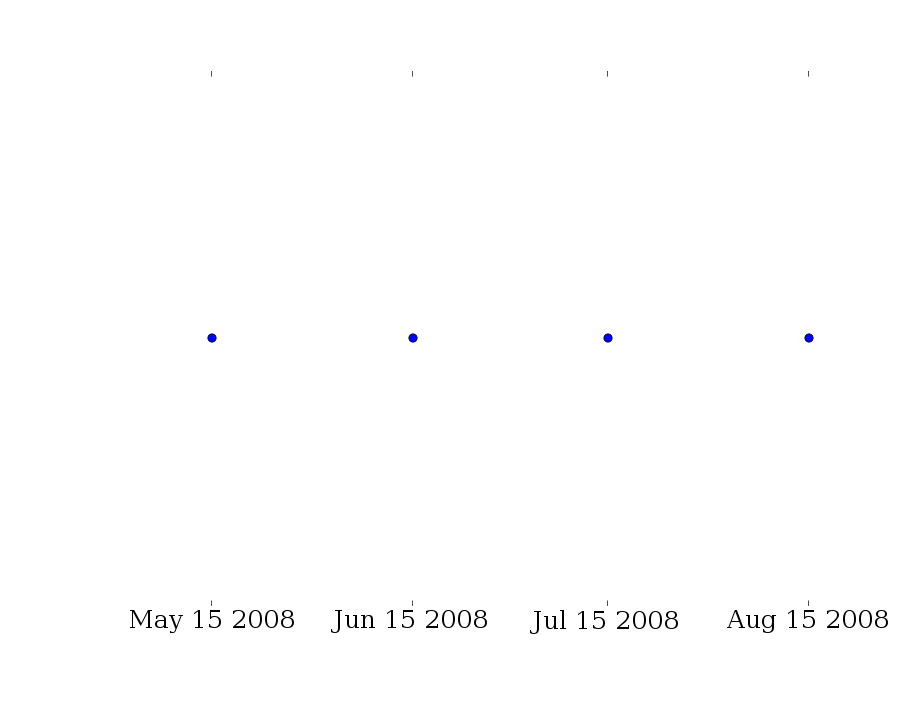
Basically, I would need a nicely formatted dates along the x-axis and
then lightly colored rectangles with text in them. The width would
show when I anticipate some part of the project starting and ending.
The y coordinate of the rectangle would used to allow project portions
to overlap. It would be nice but not essential if the rectangles had
a little fade in and out in their back ground color instead of a solid
color, but that is not essential.
Is there a clean way to do this with mpl?