Hi there,
I’m currently comparing, among others, different geospatial mpl-interfaces including cartopy and GeoPandas for a thesis. One part is comparing the total CPU runtimes of each library to generate the same map product, using the same data. The performance benchmarking is done with cProfile and the results are a bit puzzling
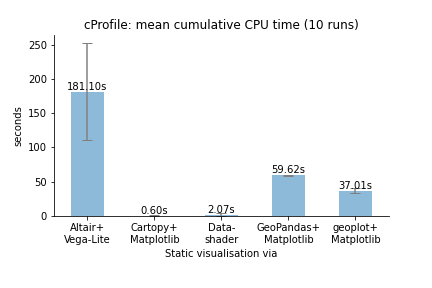
By this measure, cartopy allegedly outperforms every other library even including datashader. The cartopy and GeoPandas implementations are almost identical except for the former using add_geometries() and the latter GeoDataFrame.plot() to interface with mpl. So what do you think could be happening here?
The basic setup is this: I’m wrapping the entire figure and axes definitions, including the central add_geometries() calls for cartopy or .plot() for GeoPandas, in a function called renderFigure() which is then wrapped with a decorator that basically does this:
p = cProfile.Profile()
p.enable() # start cProfiling

value = func(*args, **kwargs) # execute renderFigure()

p.disable() # stop cProfiling
p.dump_stats() # write cProfile to file
Strangely, for the cartopy interface to mpl, the cProfiles are being created almost immediately (a print statement confirms the dump to .prof) even though the actual figures are not rendered, or show up, in the interpreter until maybe a minute later (we’re talking 144,000 partially very elaborate polygons).
For GeoPandas and geoplot, the cProfiles look more realistic. If anything, cartopy should hardly be faster than datashader.
I presume this has to do with how cartopy interfaces with the mpl renderer and when cProfile thinks the function is ‘done’ even though the interpreter or mpl renderer still has to do some work behind the scenes. Is there any way to also catch that ‘actual’ rendering done until the figure appears in the interpeter as part of a cProfile? And why does this seem to be caught for GeoPandas and geoplot but not for cartopy? Or could somebody explain what’s happening behind the scenes with either mpl or cartopy?