Dear all,
Happy new year!
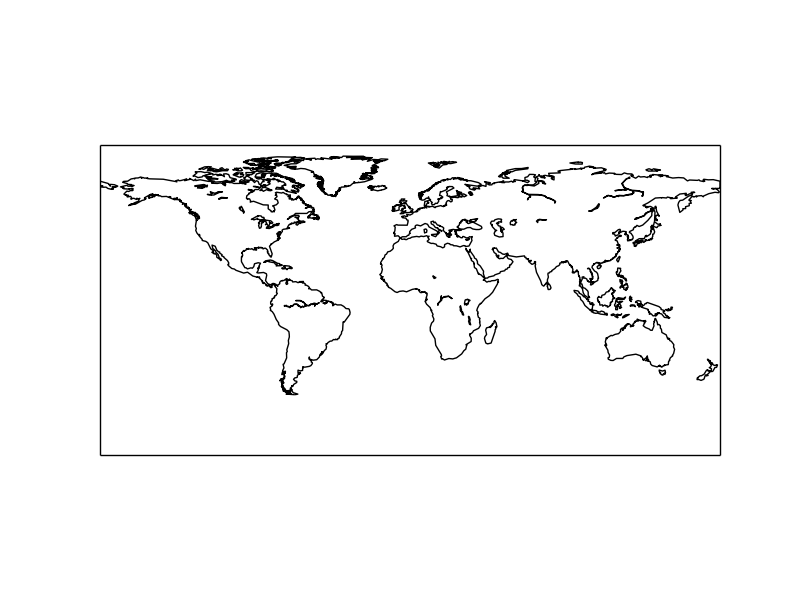
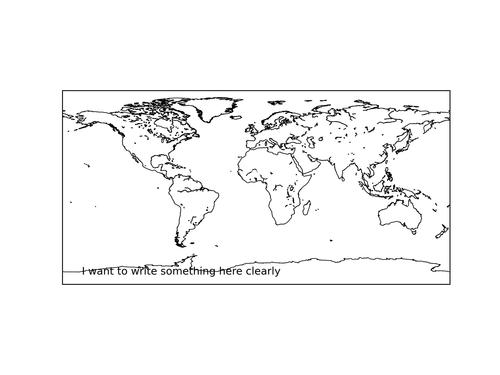
I am using Basemap toolkit to make some maps, I would like to
write something at the bottom of the map, whose position is now
taken by the contourf of Antarctica. Is there a way I can keep contours
of other continents but suppressing the one for antarctica? I attached
showing why I would like to have this.
thanks for any help,
Chao
···
–
Chao YUE
Laboratoire des Sciences du Climat et de l’Environnement (LSCE-IPSL)
UMR 1572 CEA-CNRS-UVSQ
Batiment 712 - Pe 119
91191 GIF Sur YVETTE Cedex
Tel: (33) 01 69 08 29 02; Fax:01.69.08.77.16
Chao,
I know nothing of the Basemap toolkit so I can't comment on the removal of continents, but presumably the text command you are using takes some keywords to set the properties of the bounding box. Try setting the background of the bounding box to white so that your words show up cleanly. Feel free to let me know that I'm barking up the wrong tree.
-Sterling
···
On Dec 30, 2013, at 3:46PM, Chao YUE wrote:
Dear all,
Happy new year!
I am using Basemap toolkit to make some maps, I would like to
write something at the bottom of the map, whose position is now
taken by the contourf of Antarctica. Is there a way I can keep contours
of other continents but suppressing the one for antarctica? I attached
showing why I would like to have this.
thanks for any help,
Chao
--
***********************************************************************************
Chao YUE
Laboratoire des Sciences du Climat et de l'Environnement (LSCE-IPSL)
UMR 1572 CEA-CNRS-UVSQ
Batiment 712 - Pe 119
91191 GIF Sur YVETTE Cedex
Tel: (33) 01 69 08 29 02; Fax:01.69.08.77.16
************************************************************************************
<figure_4_new.jpg>------------------------------------------------------------------------------
Rapidly troubleshoot problems before they affect your business. Most IT
organizations don't have a clear picture of how application performance
affects their revenue. With AppDynamics, you get 100% visibility into your
Java,.NET, & PHP application. Start your 15-day FREE TRIAL of AppDynamics Pro!
http://pubads.g.doubleclick.net/gampad/clk?id=84349831&iu=/4140/ostg.clktrk_______________________________________________
Matplotlib-users mailing list
Matplotlib-users@lists.sourceforge.net
matplotlib-users List Signup and Options
Hi Chao,
Actually it is possible to remove the borders for Antarctica with basemap. The default method for drawing the continents in basemap, drawcontinents(), returns an instance of matplotlib.collections.LineCollection. What you will want to do is manually remove the line segments within the collection that correspond to Antarctica. For example,
m is a Basemap instance
lcol = m.drawcoastlines()
segs = lcol.get_segments()
for i, seg in enumerate(segs):
The segments are lists of ordered pairs in spherical (lon, lat), coordinates.
We can filter out which ones correspond to Antarctica based on latitude using numpy.any()
if np.any(seg[:, 1] < -60):
segs.pop(i)
lcol.set_segments(segs)
This should do the trick unless I made a silly typo somewhere.
Thanks,
Alex
···
On Mon, Dec 30, 2013 at 5:05 PM, Sterling Smith <smithsp@…3304…> wrote:
Chao,
I know nothing of the Basemap toolkit so I can’t comment on the removal of continents, but presumably the text command you are using takes some keywords to set the properties of the bounding box. Try setting the background of the bounding box to white so that your words show up cleanly. Feel free to let me know that I’m barking up the wrong tree.
-Sterling
On Dec 30, 2013, at 3:46PM, Chao YUE wrote:
Dear all,
Happy new year!
I am using Basemap toolkit to make some maps, I would like to
write something at the bottom of the map, whose position is now
taken by the contourf of Antarctica. Is there a way I can keep contours
of other continents but suppressing the one for antarctica? I attached
showing why I would like to have this.
thanks for any help,
Chao
–
Chao YUE
Laboratoire des Sciences du Climat et de l’Environnement (LSCE-IPSL)
UMR 1572 CEA-CNRS-UVSQ
Batiment 712 - Pe 119
91191 GIF Sur YVETTE Cedex
Tel: (33) 01 69 08 29 02; Fax:01.69.08.77.16
<figure_4_new.jpg>------------------------------------------------------------------------------
Rapidly troubleshoot problems before they affect your business. Most IT
organizations don’t have a clear picture of how application performance
affects their revenue. With AppDynamics, you get 100% visibility into your
Java,.NET, & PHP application. Start your 15-day FREE TRIAL of AppDynamics Pro!
http://pubads.g.doubleclick.net/gampad/clk?id=84349831&iu=/4140/ostg.clktrk_______________________________________________
Matplotlib-users mailing list
Matplotlib-users@lists.sourceforge.net
https://lists.sourceforge.net/lists/listinfo/matplotlib-users
Rapidly troubleshoot problems before they affect your business. Most IT
organizations don’t have a clear picture of how application performance
affects their revenue. With AppDynamics, you get 100% visibility into your
Java,.NET, & PHP application. Start your 15-day FREE TRIAL of AppDynamics Pro!
http://pubads.g.doubleclick.net/gampad/clk?id=84349831&iu=/4140/ostg.clktrk
Matplotlib-users mailing list
Matplotlib-users@lists.sourceforge.net
https://lists.sourceforge.net/lists/listinfo/matplotlib-users
–
Alex Goodman
Graduate Research Assistant
Department of Atmospheric Science
Colorado State University
A quick apology for a typo in my previous message, the method in question is drawcoastlines(), not drawcontinents(). The code snippet should still be correct though!
···
On Mon, Dec 30, 2013 at 7:09 PM, Alex Goodman <alex.goodman@…4444…> wrote:
Hi Chao,
Actually it is possible to remove the borders for Antarctica with basemap. The default method for drawing the continents in basemap, drawcontinents(), returns an instance of matplotlib.collections.LineCollection. What you will want to do is manually remove the line segments within the collection that correspond to Antarctica. For example,
m is a Basemap instance
lcol = m.drawcoastlines()
segs = lcol.get_segments()
for i, seg in enumerate(segs):
The segments are lists of ordered pairs in spherical (lon, lat), coordinates.
We can filter out which ones correspond to Antarctica based on latitude using numpy.any()
if np.any(seg[:, 1] < -60):
segs.pop(i)
lcol.set_segments(segs)
This should do the trick unless I made a silly typo somewhere.
Thanks,
Alex
–
Alex Goodman
Graduate Research Assistant
Department of Atmospheric Science
Colorado State University
On Mon, Dec 30, 2013 at 5:05 PM, Sterling Smith <smithsp@…3304…> wrote:
Chao,
I know nothing of the Basemap toolkit so I can’t comment on the removal of continents, but presumably the text command you are using takes some keywords to set the properties of the bounding box. Try setting the background of the bounding box to white so that your words show up cleanly. Feel free to let me know that I’m barking up the wrong tree.
-Sterling
On Dec 30, 2013, at 3:46PM, Chao YUE wrote:
Dear all,
Happy new year!
I am using Basemap toolkit to make some maps, I would like to
write something at the bottom of the map, whose position is now
taken by the contourf of Antarctica. Is there a way I can keep contours
of other continents but suppressing the one for antarctica? I attached
showing why I would like to have this.
thanks for any help,
Chao
–
Chao YUE
Laboratoire des Sciences du Climat et de l’Environnement (LSCE-IPSL)
UMR 1572 CEA-CNRS-UVSQ
Batiment 712 - Pe 119
91191 GIF Sur YVETTE Cedex
Tel: (33) 01 69 08 29 02; Fax:01.69.08.77.16
<figure_4_new.jpg>------------------------------------------------------------------------------
Rapidly troubleshoot problems before they affect your business. Most IT
organizations don’t have a clear picture of how application performance
affects their revenue. With AppDynamics, you get 100% visibility into your
Java,.NET, & PHP application. Start your 15-day FREE TRIAL of AppDynamics Pro!
http://pubads.g.doubleclick.net/gampad/clk?id=84349831&iu=/4140/ostg.clktrk_______________________________________________
Matplotlib-users mailing list
Matplotlib-users@lists.sourceforge.net
https://lists.sourceforge.net/lists/listinfo/matplotlib-users
Rapidly troubleshoot problems before they affect your business. Most IT
organizations don’t have a clear picture of how application performance
affects their revenue. With AppDynamics, you get 100% visibility into your
Java,.NET, & PHP application. Start your 15-day FREE TRIAL of AppDynamics Pro!
http://pubads.g.doubleclick.net/gampad/clk?id=84349831&iu=/4140/ostg.clktrk
Matplotlib-users mailing list
Matplotlib-users@lists.sourceforge.net
https://lists.sourceforge.net/lists/listinfo/matplotlib-users
Alex Goodman
Graduate Research Assistant
Department of Atmospheric Science
Colorado State University
–
Hi Sterling and Alex,
thanks to both of you. I followed what proposed by you Alex and it’s working perfectly.
my version of matplotlib is 1.2.0 and I don’t want to upgrade before I submit the MS and
so I pick up the code of “get_segments” method from the github and put it in my 1.2.0
matplotlib and it works.
I wish everybody a good new year.
Chao
···
On Tue, Dec 31, 2013 at 3:09 AM, Alex Goodman <alex.goodman@…4444…> wrote:
Hi Chao,
Actually it is possible to remove the borders for Antarctica with basemap. The default method for drawing the continents in basemap, drawcontinents(), returns an instance of matplotlib.collections.LineCollection. What you will want to do is manually remove the line segments within the collection that correspond to Antarctica. For example,
m is a Basemap instance
lcol = m.drawcoastlines()
segs = lcol.get_segments()
for i, seg in enumerate(segs):
The segments are lists of ordered pairs in spherical (lon, lat), coordinates.
We can filter out which ones correspond to Antarctica based on latitude using numpy.any()
if np.any(seg[:, 1] < -60):
segs.pop(i)
lcol.set_segments(segs)
This should do the trick unless I made a silly typo somewhere.
Thanks,
Alex
–
Chao YUE
Laboratoire des Sciences du Climat et de l’Environnement (LSCE-IPSL)
UMR 1572 CEA-CNRS-UVSQ
Batiment 712 - Pe 119
91191 GIF Sur YVETTE Cedex
Tel: (33) 01 69 08 29 02; Fax:01.69.08.77.16
On Mon, Dec 30, 2013 at 5:05 PM, Sterling Smith <smithsp@…3304…> wrote:
Chao,
I know nothing of the Basemap toolkit so I can’t comment on the removal of continents, but presumably the text command you are using takes some keywords to set the properties of the bounding box. Try setting the background of the bounding box to white so that your words show up cleanly. Feel free to let me know that I’m barking up the wrong tree.
-Sterling
On Dec 30, 2013, at 3:46PM, Chao YUE wrote:
Dear all,
Happy new year!
I am using Basemap toolkit to make some maps, I would like to
write something at the bottom of the map, whose position is now
taken by the contourf of Antarctica. Is there a way I can keep contours
of other continents but suppressing the one for antarctica? I attached
showing why I would like to have this.
thanks for any help,
Chao
–
Chao YUE
Laboratoire des Sciences du Climat et de l’Environnement (LSCE-IPSL)
UMR 1572 CEA-CNRS-UVSQ
Batiment 712 - Pe 119
91191 GIF Sur YVETTE Cedex
Tel: (33) 01 69 08 29 02; Fax:01.69.08.77.16
<figure_4_new.jpg>------------------------------------------------------------------------------
Rapidly troubleshoot problems before they affect your business. Most IT
organizations don’t have a clear picture of how application performance
affects their revenue. With AppDynamics, you get 100% visibility into your
Java,.NET, & PHP application. Start your 15-day FREE TRIAL of AppDynamics Pro!
http://pubads.g.doubleclick.net/gampad/clk?id=84349831&iu=/4140/ostg.clktrk_______________________________________________
Matplotlib-users mailing list
Matplotlib-users@lists.sourceforge.net
https://lists.sourceforge.net/lists/listinfo/matplotlib-users
Rapidly troubleshoot problems before they affect your business. Most IT
organizations don’t have a clear picture of how application performance
affects their revenue. With AppDynamics, you get 100% visibility into your
Java,.NET, & PHP application. Start your 15-day FREE TRIAL of AppDynamics Pro!
http://pubads.g.doubleclick.net/gampad/clk?id=84349831&iu=/4140/ostg.clktrk
Matplotlib-users mailing list
Matplotlib-users@lists.sourceforge.net
https://lists.sourceforge.net/lists/listinfo/matplotlib-users
Alex Goodman
Graduate Research Assistant
Department of Atmospheric Science
Colorado State University
–