Dear All,
I've found it impossible to get some control over ticks in a 3D plot (Axes3D, using with projection='3d' option) in Matplotlib 1.0.1 (EPD 7.1-1 linux 64-bit). Namely, I have one out of four subplots, that is 3D and it has much to many ticks (tick labels to be exact), which makes them unreadable (most of them overlay on one another, not mentioning axis labels are covered as well). Usually in such situations I used set_x(y)ticks with some values or ax.x(y)axis.get_major_locator()._nbins if I just wanted a certain number. But I've found that _nbins doesn't do anything (also, there is no zaxis object), set_zticks return an error 'AttributeError: 'Axes3DSubplot' object has no attribute 'set_zticks'' and set_x(y)ticks changes ticks of not 3d axis but 2d one. Is there any (other) way to influence the number of ticks?
Thanks for the help in advance.
Best wishes,
Jakub
Jakub, if possible, could you test out the latest matplotlib in
development on github? I have been working hard in this. If not, you
could also always operate directly through the axis objects
themselves, such as: ax.zaxis (although, you might have to do
ax.w_zaxis).
Ben Root
···
On Tuesday, July 19, 2011, Jakub Nowacki <[email protected]...> wrote:
Dear All,
I've found it impossible to get some control over ticks in a 3D plot
(Axes3D, using with projection='3d' option) in Matplotlib 1.0.1 (EPD
7.1-1 linux 64-bit). Namely, I have one out of four subplots, that is 3D
and it has much to many ticks (tick labels to be exact), which makes
them unreadable (most of them overlay on one another, not mentioning
axis labels are covered as well). Usually in such situations I used
set_x(y)ticks with some values or ax.x(y)axis.get_major_locator()._nbins
if I just wanted a certain number. But I've found that _nbins doesn't do
anything (also, there is no zaxis object), set_zticks return an error
'AttributeError: 'Axes3DSubplot' object has no attribute 'set_zticks''
and set_x(y)ticks changes ticks of not 3d axis but 2d one. Is there any
(other) way to influence the number of ticks?
Thanks for the help in advance.
Best wishes,
Jakub
Hello,
But I've found that _nbins doesn't do
anything (also, there is no zaxis object), set_zticks return an error
'AttributeError: 'Axes3DSubplot' object has no attribute 'set_zticks''
and set_x(y)ticks changes ticks of not 3d axis but 2d one. Is there any
(other) way to influence the number of ticks?
I don't know if that will help you, but I used the command below:
a1.w_yaxis.set_major_locator(LinearLocator(5))
a1.w_zaxis.set_major_locator(LinearLocator(5))
Notice that you are not using xaxis, yaxis or zaxis, these properties
do not exist and give you the attribute error you are getting. But,
adding w_ in front of the name of the axis it works perfectly. You
can use locators and formatters in this way.
Also, notice that if you want to control axis limits, you should use
set_xlim3d, set_ylim3d and set_zlim3d. While these commands are a
little more cumbersome to use, I could get a lot of control over 3d
plots using them.
Hope this helps!
···
Em 19/07/2011, às 08:09, Jakub Nowacki escreveu:
---
José Alexandre Nalon
[email protected]...
Just a heads-up, this will no longer be necessary in the upcoming
v1.1.0 release. They will still be valid, but not required.
Ben Root
···
On Tuesday, July 19, 2011, José Alexandre Nalon <[email protected]...> wrote:
Hello,
Em 19/07/2011, às 08:09, Jakub Nowacki escreveu:
But I've found that _nbins doesn't do
anything (also, there is no zaxis object), set_zticks return an error
'AttributeError: 'Axes3DSubplot' object has no attribute 'set_zticks''
and set_x(y)ticks changes ticks of not 3d axis but 2d one. Is there any
(other) way to influence the number of ticks?
I don't know if that will help you, but I used the command below:
a1.w_yaxis.set_major_locator(LinearLocator(5))
a1.w_zaxis.set_major_locator(LinearLocator(5))
Notice that you are not using xaxis, yaxis or zaxis, these properties
do not exist and give you the attribute error you are getting. But,
adding w_ in front of the name of the axis it works perfectly. You
can use locators and formatters in this way.
Also, notice that if you want to control axis limits, you should use
set_xlim3d, set_ylim3d and set_zlim3d. While these commands are a
little more cumbersome to use, I could get a lot of control over 3d
plots using them.
Hope this helps!
Thanks for the answers.
Jakub, if possible, could you test out the latest matplotlib in
development on github? I have been working hard in this. If not, you
could also always operate directly through the axis objects
themselves, such as: ax.zaxis (although, you might have to do
ax.w_zaxis).
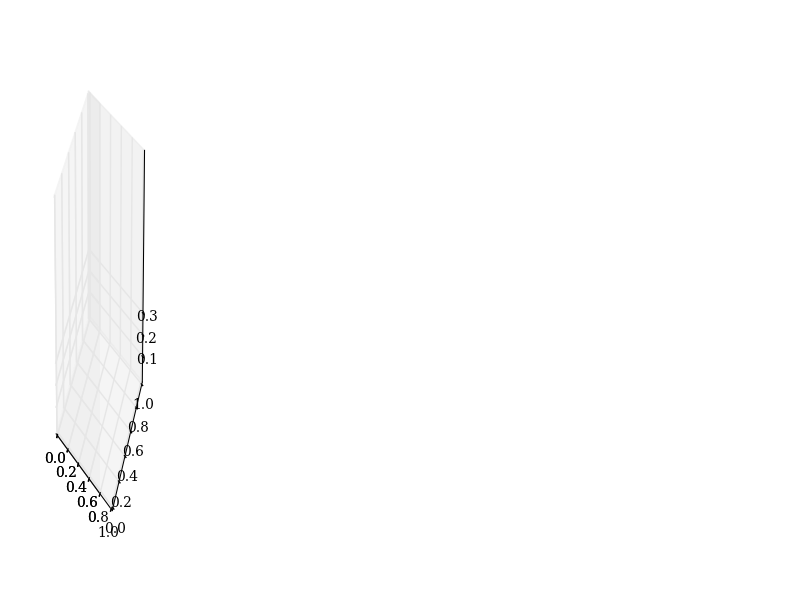
OK, I can use axis through w_*axis to control them. The function set_ticks works(ish) in that case but the axes is for some reason flushed to the left (it filled the image before) as can be seen in the enclosed image. This behaviour has nothing to do with the ticks values nor the axis (brakes the same for x, y and z axis). The selected ticks are updated though, just the whole projection (?) brakes.
The below suggestion by Jos� works correctly without the effect shown in the image.
a1.w_yaxis.set_major_locator(LinearLocator(5))
a1.w_zaxis.set_major_locator(LinearLocator(5))
As for the github version, I can try it out in some future but currently I don't have time. Also installing new stuff into EPD is not necessary too trivial.
Thanks for the suggestions.
Cheers,
Jakub
Thanks for the answers.
Jakub, if possible, could you test out the latest matplotlib in
development on github? I have been working hard in this. If not, you
could also always operate directly through the axis objects
themselves, such as: ax.zaxis (although, you might have to do
ax.w_zaxis).
OK, I can use axis through w_*axis to control them. The function set_ticks works(ish) in that case but the axes is for some reason flushed to the left (it filled the image before) as can be seen in the enclosed image. This behaviour has nothing to do with the ticks values nor the axis (brakes the same for x, y and z axis). The selected ticks are updated though, just the whole projection (?) brakes.
Curious, I haven’t encountered that before. Is it possible to include a code sample that reproduces the problem for you?
The below suggestion by José works correctly without the effect shown in the image.
a1.w_yaxis.set_major_locator(LinearLocator(5))
a1.w_zaxis.set_major_locator(LinearLocator(5))
As for the github version, I can try it out in some future but currently I don’t have time. Also installing new stuff into EPD is not necessary too trivial.
Fair enough. I am glad you found a solution that works for you.
Ben Root
···
On Tue, Jul 19, 2011 at 9:14 AM, Jakub Nowacki <j.s.nowacki@…120…287…> wrote: