Hello,
first of all: thanks for the great software!! After the years of
struggling with gnuplot, i really enjoy making my graphs with
matplotlib.
I'd like to ask, if it is possible to create a contour graph using polar
coordinates? If not, can someone give me some pointers about how to
implement it?
Kind regards,
Petr Danecek
Petr Danecek wrote:
Hello,
first of all: thanks for the great software!! After the years of
struggling with gnuplot, i really enjoy making my graphs with
matplotlib.
I'd like to ask, if it is possible to create a contour graph using polar
coordinates? If not, can someone give me some pointers about how to
implement it?
Kind regards,
Petr Danecek
Petr: I don't think contour directly supports polar axes, but if your data are in polar coordinates you can easily make a contour plot with cartesian axes, like this:
from pylab import *
deltatheta = 2.*pi/100.
theta = arange(0.,2.*pi,deltatheta)
R = arange(0.,pi,deltatheta)
r,t = meshgrid(R, theta)
Z = sin(r)*sin(3.*t)
X = r*cos(t)
Y = r*sin(t)
cs = contourf(X,Y,Z)
show()
-Jeff
···
--
Jeffrey S. Whitaker Phone : (303)497-6313
Meteorologist FAX : (303)497-6449
NOAA/OAR/PSD R/PSD1 Email : [email protected]...
325 Broadway Office : Skaggs Research Cntr 1D-124
Boulder, CO, USA 80303-3328 Web : Jeffrey S. Whitaker: NOAA Physical Sciences Laboratory
Petr Danecek wrote:
Hello,
first of all: thanks for the great software!! After the years of
struggling with gnuplot, i really enjoy making my graphs with
matplotlib.
I'd like to ask, if it is possible to create a contour graph using polar
coordinates? If not, can someone give me some pointers about how to
implement it?
Kind regards,
Petr Danecek
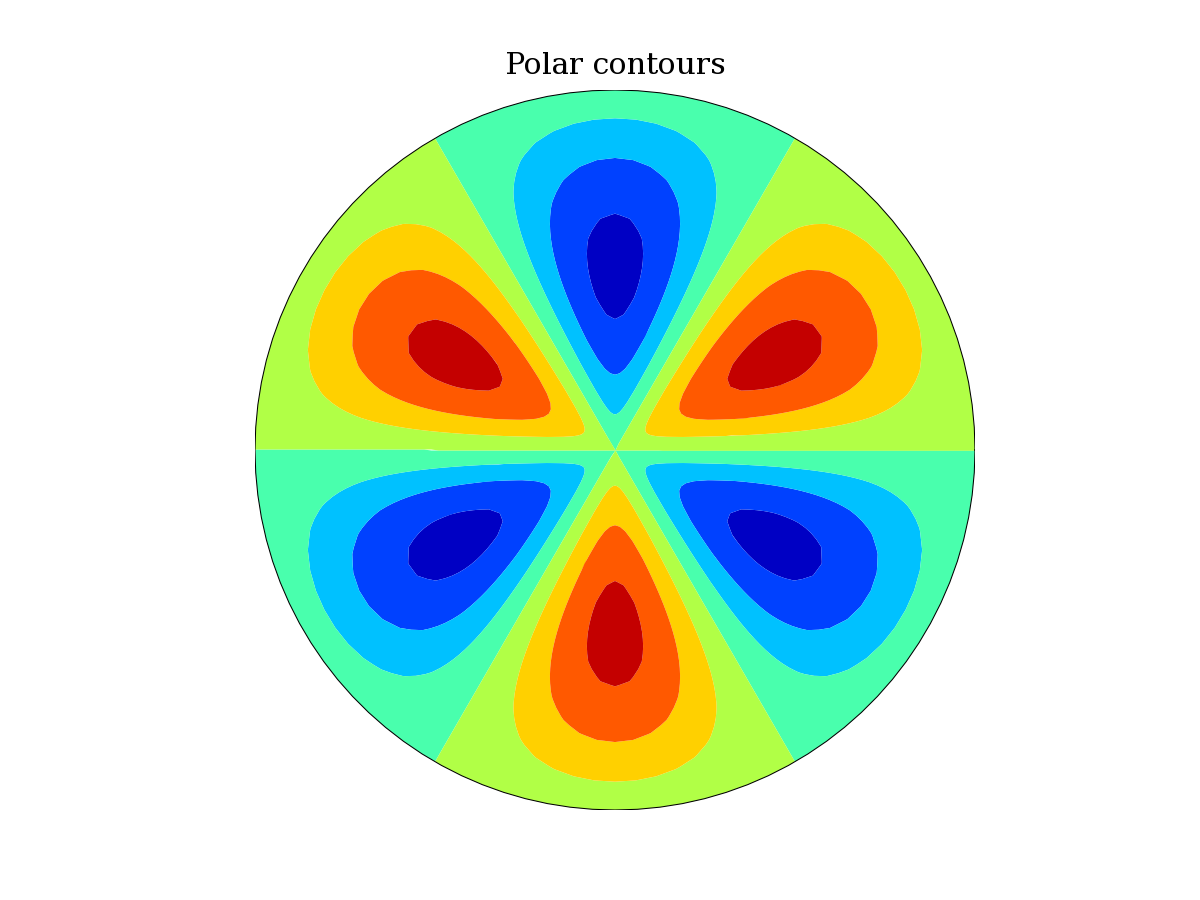
Here's a slightly prettier version of my previous example:
from pylab import *
deltatheta = 2.*pi/100.
theta = arange(0.,2.*pi+0.5*deltatheta,deltatheta)
R = arange(0.,pi,deltatheta)
r,t = meshgrid(R, theta)
Z = sin(r)*sin(3.*t)
X = r*cos(t)
Y = r*sin(t)
ax = subplot(111)
cs = ax.contourf(X,Y,Z)
# make sure aspect ratio preserved
ax.set_aspect('equal')
# turn off rectangular frame.
ax.set_frame_on(False)
# turn off axis ticks.
ax.set_xticks()
ax.set_yticks()
# draw a circle around the edge of the plot.
rmax = max(R)
ax.plot(rmax*cos(theta),rmax*sin(theta),'k')
title('Polar contours')
show()
···
--
Jeffrey S. Whitaker Phone : (303)497-6313
Meteorologist FAX : (303)497-6449
NOAA/OAR/PSD R/PSD1 Email : [email protected]...
325 Broadway Office : Skaggs Research Cntr 1D-124
Boulder, CO, USA 80303-3328 Web : http://tinyurl.com/5telg
Beautiful! The grid lines must be drawn manually?
···
On Thu, 2006-12-28 at 13:32 -0700, Jeff Whitaker wrote:
Here's a slightly prettier version of my previous example:
from pylab import *
deltatheta = 2.*pi/100.
theta = arange(0.,2.*pi+0.5*deltatheta,deltatheta)
R = arange(0.,pi,deltatheta)
r,t = meshgrid(R, theta)
Z = sin(r)*sin(3.*t)
X = r*cos(t)
Y = r*sin(t)
ax = subplot(111)
cs = ax.contourf(X,Y,Z)
# make sure aspect ratio preserved
ax.set_aspect('equal')
# turn off rectangular frame.
ax.set_frame_on(False)
# turn off axis ticks.
ax.set_xticks()
ax.set_yticks()
# draw a circle around the edge of the plot.
rmax = max(R)
ax.plot(rmax*cos(theta),rmax*sin(theta),'k')
title('Polar contours')
show()
Petr Danecek wrote:
Beautiful! The grid lines must be drawn manually?
Here's a slightly prettier version of my previous example:
from pylab import *
deltatheta = 2.*pi/100.
theta = arange(0.,2.*pi+0.5*deltatheta,deltatheta)
R = arange(0.,pi,deltatheta)
r,t = meshgrid(R, theta)
Z = sin(r)*sin(3.*t)
X = r*cos(t)
Y = r*sin(t)
ax = subplot(111)
cs = ax.contourf(X,Y,Z)
# make sure aspect ratio preserved
ax.set_aspect('equal')
# turn off rectangular frame.
ax.set_frame_on(False)
# turn off axis ticks.
ax.set_xticks()
ax.set_yticks()
# draw a circle around the edge of the plot.
rmax = max(R)
ax.plot(rmax*cos(theta),rmax*sin(theta),'k')
title('Polar contours')
show()
Petr: Yes. matplotlib has polar axes for some kinds of plots, but not for contour plots.
-Jeff
···
On Thu, 2006-12-28 at 13:32 -0700, Jeff Whitaker wrote:
--
Jeffrey S. Whitaker Phone : (303)497-6313
NOAA/OAR/CDC R/PSD1 FAX : (303)497-6449
325 Broadway Boulder, CO, USA 80305-3328
Petr Danecek wrote:
Beautiful! The grid lines must be drawn manually?
Here's a slightly prettier version of my previous example:
from pylab import *
deltatheta = 2.*pi/100.
theta = arange(0.,2.*pi+0.5*deltatheta,deltatheta)
R = arange(0.,pi,deltatheta)
r,t = meshgrid(R, theta)
Z = sin(r)*sin(3.*t)
X = r*cos(t)
Y = r*sin(t)
ax = subplot(111)
cs = ax.contourf(X,Y,Z)
# make sure aspect ratio preserved
ax.set_aspect('equal')
# turn off rectangular frame.
ax.set_frame_on(False)
# turn off axis ticks.
ax.set_xticks()
ax.set_yticks()
# draw a circle around the edge of the plot.
rmax = max(R)
ax.plot(rmax*cos(theta),rmax*sin(theta),'k')
title('Polar contours')
show()
Petr: Another option might be to use pcolor, it does work wit polar axes.
import pylab
# make color-filled plot of polar coordinate data array.
# define coordinates.
theta = pylab.linspace(0.,2.*pylab.pi,101)
R = pylab.linspace(0.,pylab.pi,101)
Y,X = pylab.meshgrid(R, theta)
# data to plot.
Z = pylab.sin(Y)*pylab.sin(4*X) + pylab.exp(-(Y**2/4))
# create subplot.
ax = pylab.subplot(111,polar=True)
# mesh fill.
ax.pcolormesh(X,Y,Z)
# make sure aspect ratio preserved
ax.set_aspect('equal')
pylab.show()
-Jeff
···
On Thu, 2006-12-28 at 13:32 -0700, Jeff Whitaker wrote:
--
Jeffrey S. Whitaker Phone : (303)497-6313
NOAA/OAR/CDC R/PSD1 FAX : (303)497-6449
325 Broadway Boulder, CO, USA 80305-3328
Petr Danecek wrote:
Beautiful! The grid lines must be drawn manually?
Here's a slightly prettier version of my previous example:
from pylab import *
deltatheta = 2.*pi/100.
theta = arange(0.,2.*pi+0.5*deltatheta,deltatheta)
R = arange(0.,pi,deltatheta)
r,t = meshgrid(R, theta)
Z = sin(r)*sin(3.*t)
X = r*cos(t)
Y = r*sin(t)
ax = subplot(111)
cs = ax.contourf(X,Y,Z)
# make sure aspect ratio preserved
ax.set_aspect('equal')
# turn off rectangular frame.
ax.set_frame_on(False)
# turn off axis ticks.
ax.set_xticks()
ax.set_yticks()
# draw a circle around the edge of the plot.
rmax = max(R)
ax.plot(rmax*cos(theta),rmax*sin(theta),'k')
title('Polar contours')
show()
Petr: Here's yet another way to do it, using the basemap toolkit. This way you get axis grid lines.
from matplotlib.toolkits.basemap import Basemap
import pylab
theta = pylab.linspace(0.,2.*pylab.pi,101)
R = pylab.linspace(0.,pylab.pi,101)
lat,lon = pylab.meshgrid(R, theta)
Z = pylab.sin(lat)*pylab.sin(4*lon) + pylab.exp(-(lat**2/4))
# convert radial coordinate to latitude, with r=0 being north pole
# and r=rmax being equator.
# convert r and theta to degrees.
lat = (180./pylab.pi)*0.5*lat[::-1,:]
lon = (180./pylab.pi)*lon
m = Basemap(boundinglat=0.,lon_0=0.,resolution=None,projection='npaeqd')
X,Y = m(lon,lat)
CS = m.contourf(X,Y,Z,15)
m.drawparallels(pylab.arange(0,90,20),labels=[1,1,1,1])
m.drawmeridians(pylab.arange(0,360,60),labels=[1,1,1,1])
pylab.show()
-Jeff
···
On Thu, 2006-12-28 at 13:32 -0700, Jeff Whitaker wrote:
--
Jeffrey S. Whitaker Phone : (303)497-6313
NOAA/OAR/CDC R/PSD1 FAX : (303)497-6449
325 Broadway Boulder, CO, USA 80305-3328
Petr Danecek wrote:
Hello,
first of all: thanks for the great software!! After the years of
struggling with gnuplot, i really enjoy making my graphs with
matplotlib.
I'd like to ask, if it is possible to create a contour graph using polar
coordinates? If not, can someone give me some pointers about how to
implement it?
John has said that he plans to improve polar coordinate handling in the next month or two. If it turns out that changes are also needed in contour.py, I will be happy to make them. So, if all goes well, within a few months we should have contouring and other things working well with polar coordinates. In the meantime, I am glad Jeff has provided a workaround.
(I took a stab at making contouring work to a useful degree with present polar coordinates--given that pcolor works, it should be possible--but I couldn't quite get it. Maybe I will try again later.)
Eric