Hello,
Is it supposed to be possible to do a filled contour plot with alpha levels in the colour map? I’m plotting weather data on top of maps and would very much like to plot low levels of wind and precipitation as mostly transparent, with higher levels more opaque.
If I replace the meat of the plotting code with these two lines:
basemap.bluemarble()
basemap.contourf(x, y, precipitation, colors=colorConverter.to_rgba_array([
no colour for zero → fully transparent
(1,0,0,0.5),
(0,1,0,1),
(0,1,1,0.5),
(0,0,1,1),
(1,0,1,0.5)
]), levels=[
no level for zero → fully transparent
0.001,
0.01,
0.1,
1,
10
])
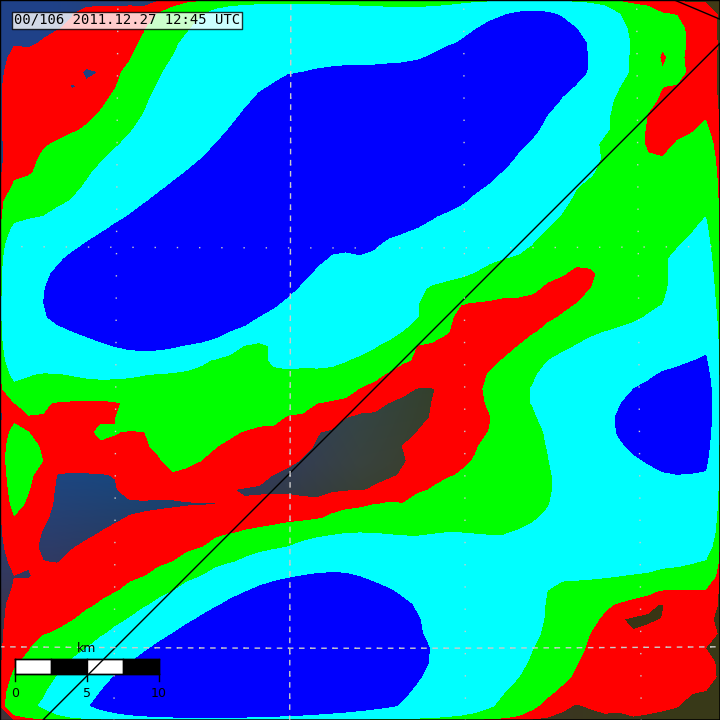
I end up with the (deliberately) pretty horrible looking plot in the attachment. The alpha values in the colors argument are completely ignored, but having no colour specified for values below 0.001 (mm/hr) causes those areas to be left transparent. I’m plotting the Blue Marble simply to have something visible under the weather plot.
Is this supposed to work at all in any way?
I’m using matplotlib 1.1.0 and basemap 1.0.2 on debian with the ‘Agg’ back-end. The data being plotted is a netCDF dataset read from the output of the WRF weather model.
Regards,
Logi
Logi: It looks like alpha transparency is controlled with the alpha keyword, so you can't specify different alphas for each contour level. You may have to call contourf multiple times, changing the alpha as needed for each set of contour levels.
-Jeff
···
On 12/27/11 12:07 PM, Logi Ragnarsson wrote:
Hello,
Is it supposed to be possible to do a filled contour plot with alpha levels in the colour map? I'm plotting weather data on top of maps and would very much like to plot low levels of wind and precipitation as mostly transparent, with higher levels more opaque.
If I replace the meat of the plotting code with these two lines:
basemap.bluemarble()
basemap.contourf(x, y, precipitation, colors=colorConverter.to_rgba_array([
# no colour for zero -> fully transparent
(1,0,0,0.5),
(0,1,0,1),
(0,1,1,0.5),
(0,0,1,1),
(1,0,1,0.5)
]), levels=[
# no level for zero -> fully transparent
0.001,
0.01,
0.1,
1,
10
])
I end up with the (deliberately) pretty horrible looking plot in the attachment. The alpha values in the colors argument are completely ignored, but having no colour specified for values below 0.001 (mm/hr) causes those areas to be left transparent. I'm plotting the Blue Marble simply to have something visible under the weather plot.
Is this supposed to work at all in any way?
I'm using matplotlib 1.1.0 and basemap 1.0.2 on debian with the 'Agg' back-end. The data being plotted is a netCDF dataset read from the output of the WRF weather model.
Regards,
Logi
Hello,
Is it supposed to be possible to do a filled contour plot with alpha
levels in the colour map? I'm plotting weather data on top of maps and
would very much like to plot low levels of wind and precipitation as
mostly transparent, with higher levels more opaque.
If I replace the meat of the plotting code with these two lines:
basemap.bluemarble()
basemap.contourf(x, y, precipitation,
colors=colorConverter.to_rgba_array([
# no colour for zero -> fully transparent
(1,0,0,0.5),
(0,1,0,1),
(0,1,1,0.5),
(0,0,1,1),
(1,0,1,0.5)
]), levels=[
# no level for zero -> fully transparent
0.001,
0.01,
0.1,
1,
10
])
I end up with the (deliberately) pretty horrible looking plot in the
attachment. The alpha values in the colors argument are completely
ignored, but having no colour specified for values below 0.001 (mm/hr)
causes those areas to be left transparent. I'm plotting the Blue
Marble simply to have something visible under the weather plot.
Is this supposed to work at all in any way?
I'm using matplotlib 1.1.0 and basemap 1.0.2 on debian with the 'Agg'
back-end. The data being plotted is a netCDF dataset read from the
output of the WRF weather model.
Regards,
Logi
Logi: It looks like alpha transparency is controlled with the alpha
keyword, so you can't specify different alphas for each contour level.
You may have to call contourf multiple times, changing the alpha as
needed for each set of contour levels.
It looks like this is something I can fix by modifying ListedColormap. It is discarding the alpha values, and I don't think there is any reason it needs to do so.
Eric
···
On 12/27/2011 03:11 PM, Jeff Whitaker wrote:
On 12/27/11 12:07 PM, Logi Ragnarsson wrote:
-Jeff
------------------------------------------------------------------------------
Write once. Port to many.
Get the SDK and tools to simplify cross-platform app development. Create
new or port existing apps to sell to consumers worldwide. Explore the
Intel AppUpSM program developer opportunity. appdeveloper.intel.com/join
http://p.sf.net/sfu/intel-appdev
_______________________________________________
Matplotlib-users mailing list
[email protected]
matplotlib-users List Signup and Options
Eric Firing, on 2011-12-27 15:31, wrote:
It looks like this is something I can fix by modifying ListedColormap.
It is discarding the alpha values, and I don't think there is any reason
it needs to do so.
One of my first attempts at a contribution to matplotlib three
years ago was related to this. It was in reply to a similar
question on list, and I wrote a patch, but never saw it through
to inclusion because it wasn't something I needed.
http://www.mail-archive.com/[email protected]/msg09216.html
I think it's a helpful starting point, as I include a discussion
on the limitation of mpl colormaps there.
···
--
Paul Ivanov
314 address only used for lists, off-list direct email at:
http://pirsquared.org | GPG/PGP key id: 0x0F3E28F7
Thank you. I think that some of the sorts of changes you had in your patch have actually been made in the interim. I now have a branch with a few small changes that I think may be all that is necessary for full support of variable alpha in colormaps. I will turn it into a pull request shortly, after a bit more testing and inclusion of an example, assuming I don't run into a major problem along the way.
Eric
···
On 12/30/2011 01:57 PM, Paul Ivanov wrote:
Eric Firing, on 2011-12-27 15:31, wrote:
It looks like this is something I can fix by modifying ListedColormap.
It is discarding the alpha values, and I don't think there is any reason
it needs to do so.
One of my first attempts at a contribution to matplotlib three
years ago was related to this. It was in reply to a similar
question on list, and I wrote a patch, but never saw it through
to inclusion because it wasn't something I needed.
Re: [Matplotlib-users] create ListedColormap with different alpha values
I think it's a helpful starting point, as I include a discussion
on the limitation of mpl colormaps there.
Eric Firing wrote:
Is it supposed to be possible to do a filled contour plot with alpha levels in the colour map? I'm plotting weather data on top of maps and would very much like to plot low levels of wind and precipitation as mostly transparent, with higher levels more opaque.
Logi: It looks like alpha transparency is controlled with the alpha keyword, so you can't specify different alphas for each contour level. You may have to call contourf multiple times, changing the alpha as needed for each set of contour levels.
-Jeff
It looks like this is something I can fix by modifying ListedColormap. It is discarding the alpha values, and I don't think there is any reason it needs to do so.
Eric
I feel that this would be a worth-while improvement to the library. In
the mean-time, I have realized that the source is all there for me to
read, and I can probably create my own patched version of
ListedColormap. Actually, I've been interpolating colours to feed to
contourf, but it would be much more sensible to use a
LinearSegmentedColormap for this. Unfortunately it also discards alpha
levels.
Regards,
Logi
PS I was getting digests of the list, so I couldn't properly respond
to Eric's mail, in case the headers look funny.
···
On Wed, Dec 28, 2011 at 1:11 AM, Jeff Whitaker <[email protected]...> wrote:
On 12/27/11 12:07 PM, Logi Ragnarsson wrote: