Friends,
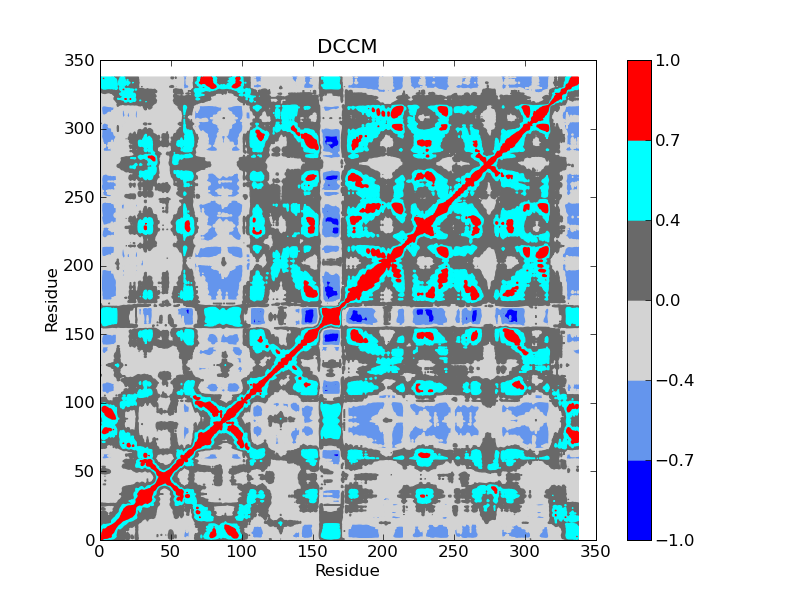
I used contourf function to plot a matrix, the output figure is attached. In the figure, i observe a strange white space at the corners. What is going wrong here. Herewith i have also attached the code.
Also someone please explaing me the usage of locator and x,y units **kargs available for contourf function.
Thanks,
Bala
cont.py (1.21 KB)
Bala,
the white space you see is due to contourf trying to have the axes ticks end on a round number. If you don’t want that behavior, you can set the limits of the plot after calling contourf() with something like this:
contourf(X, Y, Z)
xlim(x_min, x_max)
ylim(y_min, y_max)
presuming you would know which values to use for the min and max variables.
Somebody else will have to explain the locator and the x,y units kargs because I am not familiar with them.
Ben Root
···
On Wed, Jul 7, 2010 at 5:34 AM, Bala subramanian <bala.biophysics@…287…> wrote:
Friends,
I used contourf function to plot a matrix, the output figure is attached. In the figure, i observe a strange white space at the corners. What is going wrong here. Herewith i have also attached the code.
Also someone please explaing me the usage of locator and x,y units **kargs available for contourf function.
Thanks,
Bala
This SF.net email is sponsored by Sprint
What will you do first with EVO, the first 4G phone?
Visit sprint.com/first – http://p.sf.net/sfu/sprint-com-first
Matplotlib-users mailing list
[email protected]
https://lists.sourceforge.net/lists/listinfo/matplotlib-users