Contour Plotting of Varied Data on a Shape

Hello all,

This may be a difficult post to respond to in the whole, but any
pointers would be appreciated.

My overall goal is to generate contour plots for a wide range of input
data. The data points are not regularly spaced and do not align to
any grid. The data points represent measurements taken from a model
that can take on a variety of shapes. To make matters more difficult,
I'd prefer not to interpolate around corners of the model.

For example ( please forgive the ascii art ):

-----------------------|
. . . . . . . .|
. . . . . . . .|
----------------| . . .|

                 >. .|
                 >. . .|
                 >------|

In the model above the edges denoted by "|" and "-", data points
denoted by ".". This is a simple L shape with random data points
sampled.

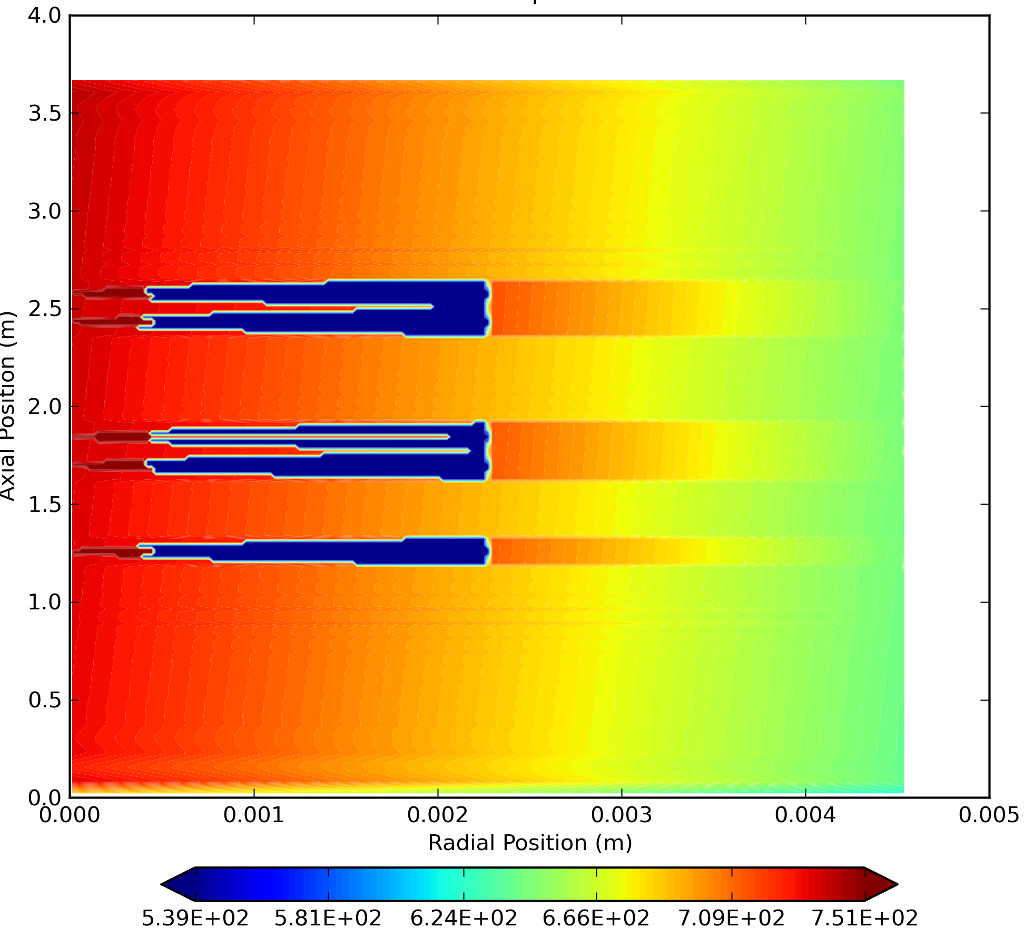
For the most part, the approaches I've taken have worked, but I am
hitting some difficult conditions to debug. Most unnerving are some
artifacts in the plot even though the data values are fairly uniform
(see attached image "fail.png" ).

The general approach I'm taking goes as follows:

1 ) Make a linear space for the x and y components of the data and the
model ( def_points_x is unique and sorted sorted in the code example
):
     # model boundary points x
      x_def = linspace( def_points_x[0], def_points_x[-1],
self.num_points_x ) # do something similar for x and y of data and
model points

2) Triangulate on the points
        try:
            ltri = delaunay.Triangulation( array( xPoints ), array(
yPoints ) ) # xPoints and yPoints are data points
        except:
            ltri = ( None, None, None )
3) use the natural neighbor extrapolator
        if extrapolate:
            # extrapolate
            try:
                interp_extrap = ltri.nn_extrapolator( region_values )
# values for the data points in same order ( i.e., ( xPoints[1],
yPoints[1] ) -> region_values[1] )
            except:
                return ( None, None, None)
4) extrapolate to the model boundary
        x2,y2 = meshgrid( x_def, y_def ) # model boundary region
        z = interp_extrap( x2, y2 )

5) plot the result
        contourf( x_def, y_def, z, linspace( minValue, maxValue,
self.numberOfContourLevels ), zorder = 50, extend = 'both' )

I've attached two images, one showing a nice result and one showing artifacts.

Am I completely off base in this approach, hence I cannot seem to
"perfect" the results? Suggestions?

Thanks for reading!
-Erik

Erik Schweller wrote:

My overall goal is to generate contour plots for a wide range of input
data. The data points are not regularly spaced and do not align to
any grid. The data points represent measurements taken from a model
that can take on a variety of shapes. To make matters more difficult,
I'd prefer not to interpolate around corners of the model.

It strikes me that when you are working with unstructured data like this, it may be better to keep it unstrucured -- do the delanauy triangulation and directly contour from that. It's actually prety easy to contour a triangular mesh.

Unfortunately, I haven't see code to do it in scipy or MPL. Am I wrong? Is there something there. If not, there really should be it seems a bit silly to shoehorn your data to a rectangular grid just to contour it.

I suppose NN interpolation is essentially doing this already, but it introduces issues with a boundary that doesnt' line up to a rectangular grid.

As I think about it, I'm going to have to write code to do this (contour an unstructured triangular mesh) sometime soon, so please let me know if it does exist already -- if not I'll try to remember to contribute it when I get around to it.

-Chris

···

--
Christopher Barker, Ph.D.
Oceanographer

Emergency Response Division
NOAA/NOS/OR&R (206) 526-6959 voice
7600 Sand Point Way NE (206) 526-6329 fax
Seattle, WA 98115 (206) 526-6317 main reception

Chris.Barker@...259...

Christopher Barker wrote:

Erik Schweller wrote:

My overall goal is to generate contour plots for a wide range of input
data. The data points are not regularly spaced and do not align to
any grid. The data points represent measurements taken from a model
that can take on a variety of shapes. To make matters more difficult,
I'd prefer not to interpolate around corners of the model.

It strikes me that when you are working with unstructured data like
this, it may be better to keep it unstrucured -- do the delanauy
triangulation and directly contour from that. It's actually prety easy
to contour a triangular mesh.

Unfortunately, I haven't see code to do it in scipy or MPL. Am I wrong?
Is there something there. If not, there really should be it seems a bit
silly to shoehorn your data to a rectangular grid just to contour it.

I suppose NN interpolation is essentially doing this already, but it
introduces issues with a boundary that doesnt' line up to a rectangular
grid.

As I think about it, I'm going to have to write code to do this (contour
an unstructured triangular mesh) sometime soon, so please let me know if
it does exist already -- if not I'll try to remember to contribute it
when I get around to it.

-Chris

Chris, I found this old thread. Did you ever find code to directly
interpolate a triangulation? I need to do the same thing.

Thanks,
Geoff

···

--
Geoffrey Ely
gely@...1887...

Department of Earth Sciences
University of Southern California
Los Angeles, CA 90089-0740

--
View this message in context: http://old.nabble.com/Contour-Plotting-of-Varied-Data-on-a-Shape-tp25089018p27826931.html
Sent from the matplotlib - users mailing list archive at Nabble.com.

gely wrote:

As I think about it, I'm going to have to write code to do this (contour an unstructured triangular mesh) sometime soon, so please let me know if it does exist already -- if not I'll try to remember to contribute it when I get around to it.

-Chris

Chris, I found this old thread. Did you ever find code to directly
interpolate a triangulation?

sorry, no, not yet.

Do you already have the triangulation? if so, it's pretty easy to contour.

-Chris

···

--
Christopher Barker, Ph.D.
Oceanographer

Emergency Response Division
NOAA/NOS/OR&R (206) 526-6959 voice
7600 Sand Point Way NE (206) 526-6329 fax
Seattle, WA 98115 (206) 526-6317 main reception

Chris.Barker@...259...

Christopher Barker wrote:

gely wrote:

As I think about it, I'm going to have to write code to do this (contour
an unstructured triangular mesh) sometime soon, so please let me know if
it does exist already -- if not I'll try to remember to contribute it
when I get around to it.

-Chris

Chris, I found this old thread. Did you ever find code to directly
interpolate a triangulation?

sorry, no, not yet.

Do you already have the triangulation? if so, it's pretty easy to contour.

Thanks for the reply. Yes. I have the triangulation as a list of point
coordinates and a list of triangles with indices to the points. Good to know
it's not difficult. I'll have to chew on this for a bit.

-Geoff

···

--
View this message in context: http://old.nabble.com/Contour-Plotting-of-Varied-Data-on-a-Shape-tp25089018p27829342.html
Sent from the matplotlib - users mailing list archive at Nabble.com.

Hello all,

I submitted some code to matplotlib-users last September to perform
contouring of triangular grids. The posts and code can be found at:

http://sourceforge.net/mailarchive/forum.php?thread_name=4AB3B95B.3090903%40noaa.gov&forum_name=matplotlib-users

Like I wrote at the time, if it is useful to enough people I'm happy
to improve the code provided it can be incorporated into mpl as I have
no interest in maintaining it as a standalone project.

Ian

···

On 8 March 2010 23:33, gely <gely@...1887...> wrote:

Christopher Barker wrote:

gely wrote:

As I think about it, I'm going to have to write code to do this (contour
an unstructured triangular mesh) sometime soon, so please let me know if
it does exist already -- if not I'll try to remember to contribute it
when I get around to it.

-Chris

Chris, I found this old thread. Did you ever find code to directly
interpolate a triangulation?

sorry, no, not yet.

Do you already have the triangulation? if so, it's pretty easy to contour.

Thanks for the reply. Yes. I have the triangulation as a list of point
coordinates and a list of triangles with indices to the points. Good to know
it's not difficult. I'll have to chew on this for a bit.

-Geoff
--
View this message in context: http://old.nabble.com/Contour-Plotting-of-Varied-Data-on-a-Shape-tp25089018p27829342.html
Sent from the matplotlib - users mailing list archive at Nabble.com.

------------------------------------------------------------------------------
Download Intel&#174; Parallel Studio Eval
Try the new software tools for yourself. Speed compiling, find bugs
proactively, and fine-tune applications for parallel performance.
See why Intel Parallel Studio got high marks during beta.
http://p.sf.net/sfu/intel-sw-dev
_______________________________________________
Matplotlib-users mailing list
Matplotlib-users@lists.sourceforge.net
matplotlib-users List Signup and Options

Ian Thomas wrote:

I submitted some code to matplotlib-users last September to perform
contouring of triangular grids. The posts and code can be found at:

Thread: [Matplotlib-users] Contouring on triangular grids | matplotlib

Like I wrote at the time, if it is useful to enough people I'm happy
to improve the code provided it can be incorporated into mpl as I have
no interest in maintaining it as a standalone project.

I think it would be great to have in MPL.

What code are you using for the triangulation? Does it do constrained delauney?

-Chris

···

--
Christopher Barker, Ph.D.
Oceanographer

Emergency Response Division
NOAA/NOS/OR&R (206) 526-6959 voice
7600 Sand Point Way NE (206) 526-6329 fax
Seattle, WA 98115 (206) 526-6317 main reception

Chris.Barker@...259...

Chris Barker wrote:

I think it would be great to have in MPL.

What code are you using for the triangulation? Does it do constrained
delauney?

My code only does the contouring; you have to input the triangulation.
In the examples included with the code I used matplotlib.delaunay to
do the triangulations so as not to reinvent the wheel.

To include it in MPL, I would need to improve it somewhat (there are a
couple of known bugs and insufficient documentation) and there would
need to be a discussion of the API. At the moment I am using

    tricontour(x, y, triangulation_indices, z, optional_mask)

followed by the usual contour args (N or V) and kwargs. Is this OK?
I've also written utility plotting functions triplot, trifill and
tripcolor; are these wanted?

In terms of implementation, at the python level I have a TriContourSet
class which is the same as the existing ContourSet apart from a few
lines that deal with input arguments and calling the appropriate
underlying C++ code. Ideally it would be sensible to refactor the
common python code into a new class (BaseContourSet?) and have
relatively thin derived ContourSet and TriContourSet classes. But I'm
not sure you'd like a relatively new mpl contributor to change such
important code...

Ian

Ian Thomas wrote:

Chris Barker wrote:

I think it would be great to have in MPL.

What code are you using for the triangulation? Does it do constrained
delauney?

My code only does the contouring; you have to input the triangulation.
In the examples included with the code I used matplotlib.delaunay to
do the triangulations so as not to reinvent the wheel.

To include it in MPL, I would need to improve it somewhat (there are a
couple of known bugs and insufficient documentation) and there would
need to be a discussion of the API. At the moment I am using

    tricontour(x, y, triangulation_indices, z, optional_mask)

followed by the usual contour args (N or V) and kwargs. Is this OK?
I've also written utility plotting functions triplot, trifill and
tripcolor; are these wanted?

In terms of implementation, at the python level I have a TriContourSet
class which is the same as the existing ContourSet apart from a few
lines that deal with input arguments and calling the appropriate
underlying C++ code. Ideally it would be sensible to refactor the
common python code into a new class (BaseContourSet?) and have
relatively thin derived ContourSet and TriContourSet classes. But I'm
not sure you'd like a relatively new mpl contributor to change such
important code...

Ian,

As the person who fixed major bugs in cntr.c, you have wizard status, so go ahead! I have no objection to some refactoring, so long as everything works in the end, and is no more difficult to read and maintain than what is there now--which I am sure could be improved even without the Tri additions.

What sort of timeline do you have in mind?

One possibility would be to develop the tri* functionality at least initially as a module in lib/mpl_toolkits, like axes_grid and mplot3d; or in a module in lib/matplotlib. This could still take advantage of refactoring in contour.py. An advantage is that it would consolidate the triangle functionality so it would be easier to find, track, and document.

I copied this reply to the devel list--let's continue there as needed.

Eric

···

Ian