Hi,
I'm not sure whether my previous mail has really reached the mailing list or not. Excuse me if it is posted twice.
Currently I have written a wrapper script that allows me to set all types of margins in inches instead of relative coordinates:
width -- the width of the figure in inches
height -- the height of the figure in inches
margins -- a list of margins [left, right, bottom, top] in inches
spacing -- a list containing the horizontal and the vertical spacing
between the subplots.
pylab.gcf().set_figsize_inches(width, height)
all_axes_width = (width - margins[0] - margins[1])
axes_width = (all_axes_width - (pylab.gca().numCols - 1)*spacings[0])/pylab.gca().numCols
all_axes_height = (self.height - margins[2] - margins[3])
axes_height = (all_axes_height - (pylab.gca().numRows - 1)*spacings[1])/pylab.gca().numRows
pylab.subplots_adjust(
left=margins[0]/width,
right=1-margins[1]/width,
bottom=margins[2]/height,
top=1-margins[3]/height,
wspace=spacings[0]/axes_width,
hspace=spacings[1]/axes_height
)
I wonder if their is a cleaner way of doing this, without a wrapper function? Is it possible to organize multiple axes in a plot in another way than using the pylab.subplot function?
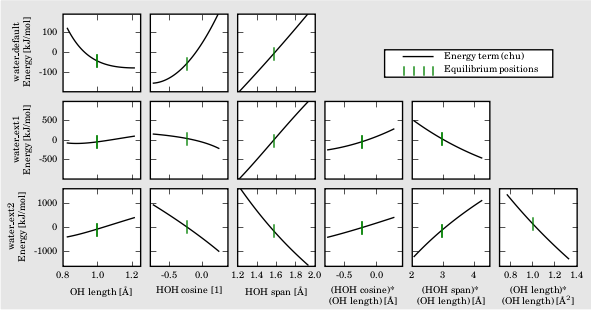
I'm currently preparing a publication for which the plots are created with matplotlib, and I would like to share some of my experiences. The (future) ambition of matplotlib is to create plots that are publication-ready. For basic plots this is certainly no problem at all, but for complex plots containing multiple axes etc, the pylab.subplot function is too restrictive.
As an example, I have attached one of the types of plots I'm working on. I have to use wrapper functions like the one given above, to make sure that the subplots are squares and the horizontal and vertical distances between them are equal. This is luckily not a blocker, but the choice of working with relative coordinates, is not always ideal. A problem I could not solve up to know, is aligning the labels at the left and the bottom of the plot. Don't get me wrong, I know that it is very difficult to implement a plotting interface that is able to deal with all these details.
Are their any development plans to go further that the subplot- interface? I have some experience with writing GTK-applications. The GTK library contains a series of widgets (tables, hboxes, vboxes, ...) that are purely used for organizing the positions and sizes of the actual widgets of interest (entries, buttons, labels, ...). A similar approach in matplotlib would be a great improvement. The organizational widgets should have properties like margins, spacings, ..., that can be given in different units (relative or absolute). The actual widgets of interest in this analogy are axes, labels (for the title and axislabels), ticks with labels and legends.
What do you matplotlib-people think of such an idea? Is it completely over-engineered? Maybe some parts are already partially implemented? I would be happy to work out this idea and start implementing it. It's a rather huge job, as I am not yet familiar with the complete matplotlib code. Some discussion in advance, also with non-developers, is therefore more than welcome. Shoot!
regards,
Toon