Hi all,
First of all, best wishes for the brand new year! I hope that 2007 will be a great year for all of you.
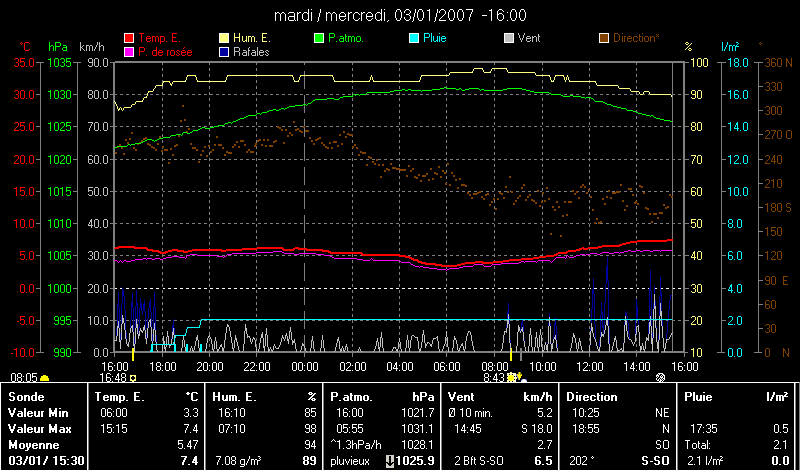
Attached to this mail, there is an image representing a 'complex plot'. this is complex because it contains a lot of information (plot + table below the plot). I think the plot + table is not so difficult to do using matplotlib (the example table_demo.py should give an idea of the solution).
What is, in my opinion more is:
- the fact that the plot contains 6 vertical axis (three on the left and three on the right).
- the legend is above the plot and is composed of color boxes that refer to a given axis and line on the plot.
Do you think it is possible to do such a plot in matplotlib?
Thanks in advance for any kind of help and thanks again for the matplotlib library!
Best regards.
Benoit
