Many higher level applications produce figures, typically when the figure itself is a composite of multiple axes, hence the option to pass an Axes instance is not available. Often the actual creation of the Figure is buried deeply in a call stack, making it difficult to intercept. I’ve seen the new subfigures feature of matplotlib, which is so new that limiting a search to the past one year finds only a handful of pages on the internet. I know there is no public API and design intention at the moment to convert a Figure to a SubFigure and include it in a main Figure. However, because this feature is so much desired and would be so useful for many, I thought it is worth to look a bit deeper whether it’s a low hanging fruit, or there are major obstacles. I show here just a little example of creating two figures and trying to make them subfigures. The to_subfig is more or less a copy of SubFigure.__init__.
import matplotlib as mpl
from matplotlib.transforms import BboxTransformTo
import numpy as np
def to_subfig(fig, sfig):
fig.__class__ = mpl.figure.SubFigure
fig._subplotspec = sfig._subplotspec
fig._parent = sfig._parent
fig.figure = sfig.figure
# subfigures use the parent axstack
fig._axstack = sfig._axstack
fig.subplotpars = sfig.subplotpars
fig.dpi_scale_trans = sfig.dpi_scale_trans
fig._axobservers = sfig._axobservers
fig.canvas = sfig.canvas
fig.transFigure = sfig.transFigure
fig.bbox_relative = None
fig._redo_transform_rel_fig()
fig.figbbox = fig._parent.figbbox
fig.bbox = sfig.bbox
fig.transSubfigure = BboxTransformTo(fig.bbox)
fig.patch = sfig.patch
fig.patch.figure = fig
fig._set_artist_props(fig.patch)
fig.patch.set_antialiased(False)
return fig
fig1 = mpl.figure.Figure(constrained_layout = True)
ax1 = fig1.add_subplot()
ax1.scatter(
np.random.random(10),
np.random.random(10)
)
fig2 = mpl.figure.Figure(constrained_layout = True)
ax2 = fig2.add_subplot()
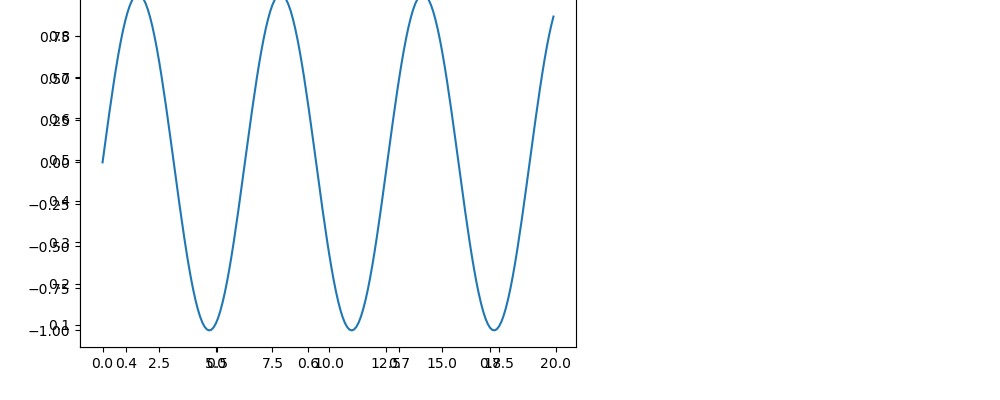
x = np.arange(0, 20, .1)
ax2.plot(
x,
np.sin(x)
)
mainfig = mpl.figure.Figure(constrained_layout = True, figsize = (10, 4))
subf = mainfig.subfigures(1, 2)
fig1 = to_subfig(fig1, subf[0])
fig2 = to_subfig(fig2, subf[1])
mainfig.subfigs = [fig1, fig2]
mainfig.savefig('mainfig.png')
Looking at the output, both figures are drawn but at wrong position and scaling:
Despite the bboxes seem to be alright:
fig1.bbox._bbox
# Bbox([[0.0, 0.0], [0.5, 1.0]])
fig2.bbox._bbox
# Bbox([[0.5, 0.0], [1.0, 1.0]])
I am wondering if someone with more insight about matplotlib design might be able to tell what is missing here? Is it just a few steps away, or is it impossible?