I’m using a TwoSlopeNorm to visualize two different colormaps around a center point. I noticed that in previous Matplotlib versions, the colorbar scale was linear, as shown in an older documentation page. The latest Matplotlib version somehow rescales both sides around the midpoint to equal lengths (see the current documentation). Here’s a figure illustrating the differences:
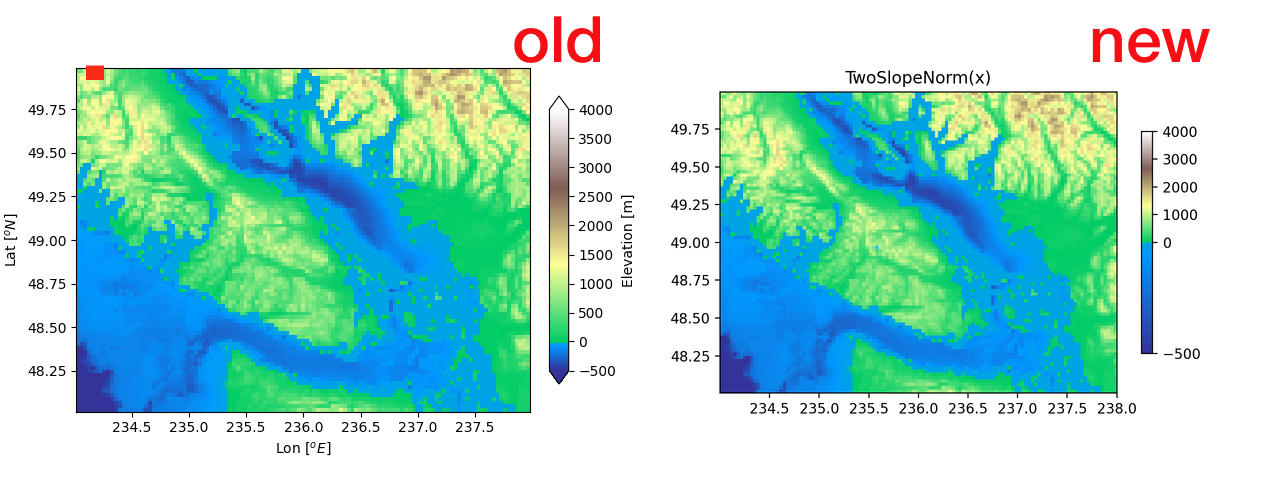
I really prefer the old look, how can I revert/change my colorbar scale so that it matches the previous behavior?