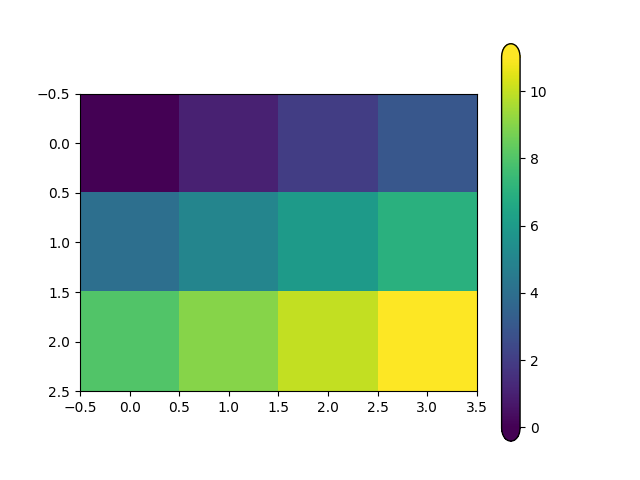
Hello everyone,
Is there a way to create a colorbar with the top and bottom edges being rounded, like in the image below?

Thank you!
Hello everyone,
Is there a way to create a colorbar with the top and bottom edges being rounded, like in the image below?

Thank you!
Anything is possible, but not automatically.
What strategy would you suggest to tackle this?
I can hide the edges and since colorbar is an axis i can draw my custom curved lines, but the first and last colors are squares so they will intersect with the curves.
Probably the place to start is the implementation of the extended colorbar with the triangle top and bottom edges. I ll have a look.
I wouldn’t implement this until Enh better colorbar axes by jklymak · Pull Request #18900 · matplotlib/matplotlib · GitHub goes in. It is changing the end regions from a distorted pcolormesh to a triangle patch. If its a triangle patch, its pretty easy to make a rounded patch.
I think I did it! Thanks for merging this PR.
Here is my code:
import numpy as np
import matplotlib.pyplot as plt
import matplotlib.path as mpath
import matplotlib.patches as patches

Path = mpath.Path

orientation = "vertical"

data = np.arange(12).reshape(3, 4)
fig, ax = plt.subplots()
cmap = plt.get_cmap("viridis")
im = ax.imshow(data, cmap=cmap)
cb = fig.colorbar(im, orientation=orientation)

# Hide outline
cb.outline.set_visible(False)

# Extend colorbar
bot = -0.05
top = 1.05

# Upper bound
xy = np.array([[0, 1], [0, top], [1, top], [1, 1]])
if orientation == "horizontal":
    xy = xy[:, ::-1]

# Make Bezier curve
curve = [
    Path.MOVETO,
    Path.CURVE4,
    Path.CURVE4,
    Path.CURVE4,
]

color = cb.cmap(cb.norm(cb._values[-1]))
patch = patches.PathPatch(
    mpath.Path(xy, curve),
    facecolor=color,
    linewidth=0,
    antialiased=False,
    transform=cb.ax.transAxes,
    clip_on=False,
)
cb.ax.add_patch(patch)

# Lower bound
xy = np.array([[0, 0], [0, bot], [1, bot], [1, 0]])
if orientation == "horizontal":
    xy = xy[:, ::-1]

color = cb.cmap(cb.norm(cb._values[0]))
patch = patches.PathPatch(
    mpath.Path(xy, curve),
    facecolor=color,
    linewidth=0,
    antialiased=False,
    transform=cb.ax.transAxes,
    clip_on=False,
)
cb.ax.add_patch(patch)


# Outline
xy = np.array(
    [[0, 0], [0, bot], [1, bot], [1, 0], [1, 1], [1, top], [0, top], [0, 1], [0, 0]]
)
if orientation == "horizontal":
    xy = xy[:, ::-1]

curve = [
    Path.MOVETO,
    Path.CURVE4,
    Path.CURVE4,
    Path.CURVE4,
    Path.LINETO,
    Path.CURVE4,
    Path.CURVE4,
    Path.CURVE4,
    Path.LINETO,
]
path = mpath.Path(xy, curve, closed=True)

patch = patches.PathPatch(
    path, facecolor="None", lw=1, transform=cb.ax.transAxes, clip_on=False
)
cb.ax.add_patch(patch)
and here is the output:

Looks cool; Not 100% crazy that we could add this to the main library as it is pretty low level for most users. If you decided to contribute a PR, there would have to be an easy way to access the new shape, and clear docs, preferably with examples, but it looks like the kind of thing others may be interested in!
I would be very interested in contributing to matplotlib! But I have zero experience with “real” software development (I am more in the academic/scientific code development where codes are floating around in the lab using usb sticks :p), so bare with me.
I read the develop/contributing page: Contributing — Matplotlib 3.5.1 documentation
Everything looks clear enough. I think I managed to implement it and it works good enough, I will write some docs, examples and submit a PR!