Hi,
I am repeating the same query that I have created over stackoverflow (python - How to deal with the colorbar axis space in matplotlib subplots - Stack Overflow).
I am specifically dealing with geographic coordinated matplotlib sub_plots and weird colorbar behavior that reduces my last column map size.
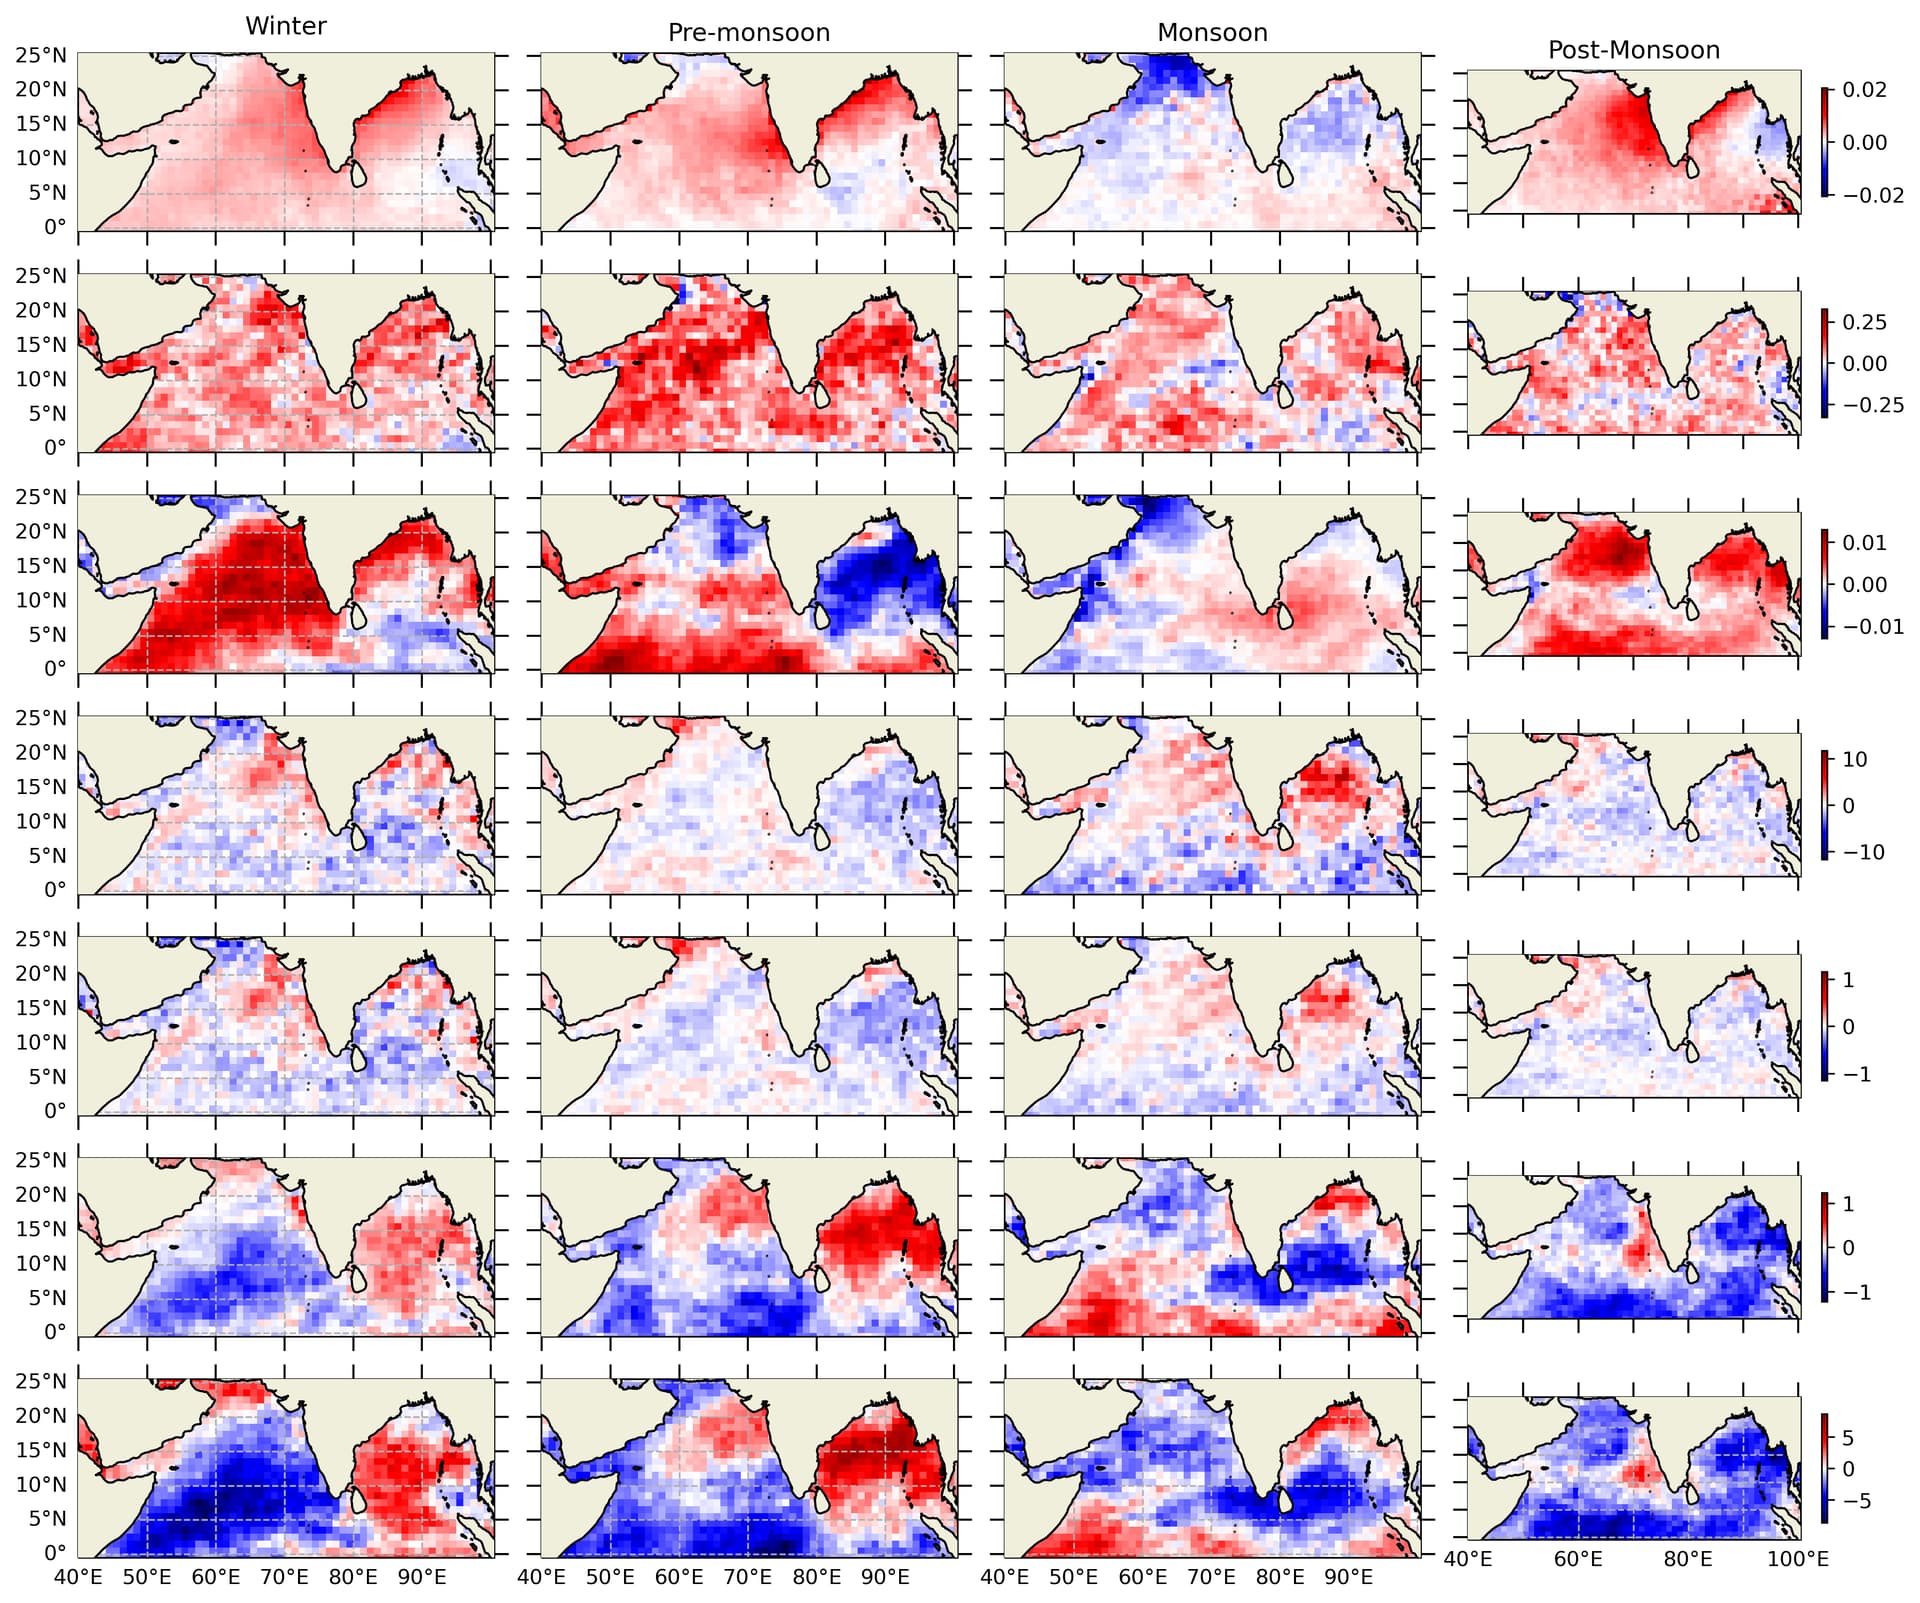
How to fix it! any sort of hack from the community!! Track my script on stackoverflow link.
Thanks