Hello guys,
I hope you are doing well. Here is my problem :
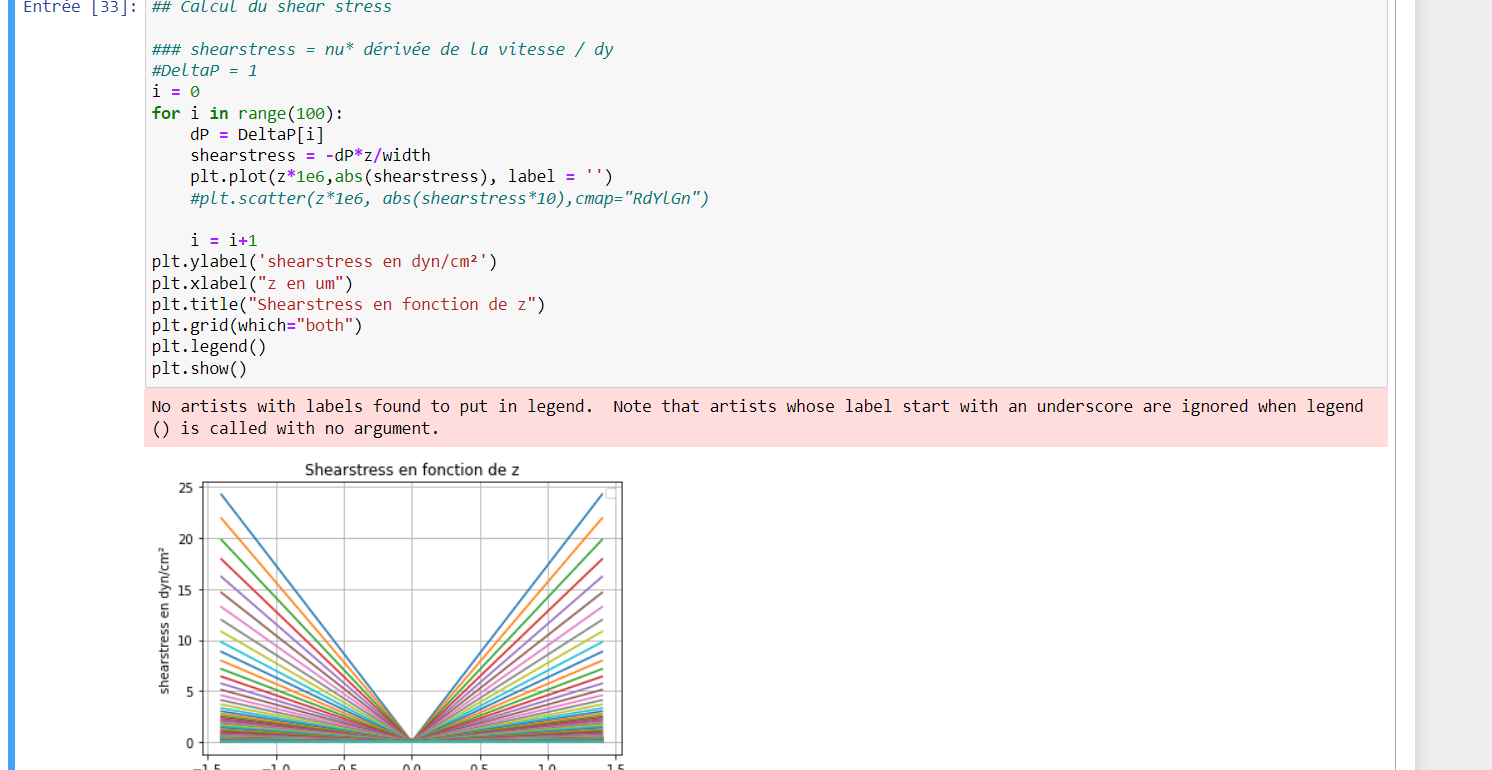
I plot a function depending on Z for different value of DeltaP.
I would like to add a gradient color as legend for DeltaP but I don’t find easy solution.
Here is my code and the plot :
I would appreciate if someone already did a gradient color legend with plt.plot
I manage to do it with plt.scatter and plt.colorbar but the colorbar works for my function value and not for the different value of Delta P
Have a great day!