Hi, I tried to plot multiple contours then blend it to make it seem overlayed.
This is my code snippet, and this is how my figure looks like.
import numpy as np
import matplotlib.pyplot as plt
from matplotlib.colors import Normalize

X_2d = [[100, -400], [101, -404], [102, -408], [103, -412]]
torch_X_2d = torch.tensor(X_2d, dtype =torch.float)
HSIC_2d, (width_x_2d, width_x_2d_) = normalized_HSIC(torch_X_2d, torch_X_2d, return_width=True, kernel_param_average_method='mean') # ignore this
X_2d = np.asarray(X_2d)

plt.figure(figsize=(10, 10))
	plt.xlabel('x1')
	plt.ylabel('x2')

	sigma_x_2d = width_x_2d # scalar case

	n_grid = 51
	x1linspace = np.linspace(-3*sigma_x_2d, 3*sigma_x_2d, n_grid)
	x2linspace = np.linspace(-3*sigma_x_2d, 3*sigma_x_2d, n_grid)
	x1x1, x2x2 = np.meshgrid(x1linspace, x2linspace)
	print("x1x1 shpae", x1x1.shape)
	print("x2x2 shpae", x2x2.shape)

	kernel_Y = np.exp(- (x1x1*x1x1 + x2x2*x2x2)/ (sigma_x_2d)**2 ) # scalar case

	x1_min = 0
	x1_max = 0
	x2_min = 0
	x2_max = 0

	step = 0.02
	m = torch.amax(kernel_Y)
	levels = np.arange(0.0, m, step) + step
	cmap = ["Reds", "Blues", "Greens", "Purples"]

	alphas = Normalize(0, .3, clip=True)(np.abs(kernel_Y))
	alphas = np.clip(alphas, .4, 1)  # alpha value clipped at the bottom at .4
	print("alphas shape", alphas.shape)
	print(alphas)


	for i, x in enumerate(X_2d) :
		print("x", x)
		print("x1x1", x1x1)
		contour = plt.contour(x[0]+x1x1, x[1]+x2x2, kernel_Y, cmap = "viridis_r", levels=7, alpha=0.6, linewidths=1, vmin=0)
		contourf = plt.contourf(x[0] + x1x1, x[1] + x2x2, kernel_Y, cmap=cmap[i], levels=levels, alpha=0.5, vmin=0)
		if i == 0 :
			plt.clabel(contour, inline=True, fontsize=10)
		plt.title('isotropic kernel')

	x1_min = min(X_2d[:,0])
	x1_max = max(X_2d[:,0])
	x2_min = min(X_2d[:,1])
	x2_max = max(X_2d[:,1])

	x1_axis_min = min( x1_min - (x1_max - x1_min)*0.2, min(X_2d[:,0])-2*sigma_x_2d)
	x1_axis_max = max( x1_max + (x1_max - x1_min)*0.2, max(X_2d[:,0])+2*sigma_x_2d)
	x2_axis_min = min( x2_min - (x2_max - x2_min)*0.2, min(X_2d[:,1])-2*sigma_x_2d)
	x2_axis_max = max( x2_max + (x2_max - x2_min)*0.2, max(X_2d[:,1])+2*sigma_x_2d)


	plt.axis((x1_axis_min, x1_axis_max, x2_axis_min, x2_axis_max))
	plt.scatter(X_2d[:,0],X_2d[:,1], color='red')
	plt.colorbar(contourf)

	plt.show()
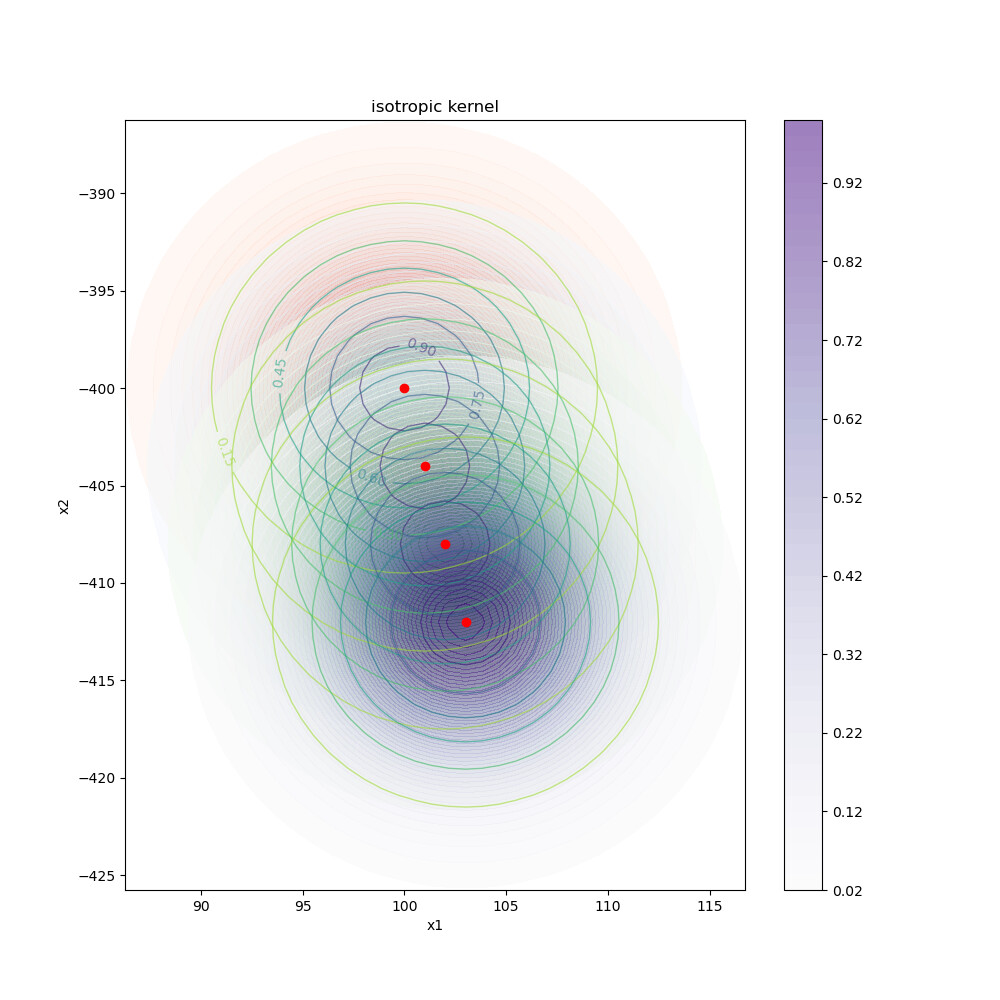
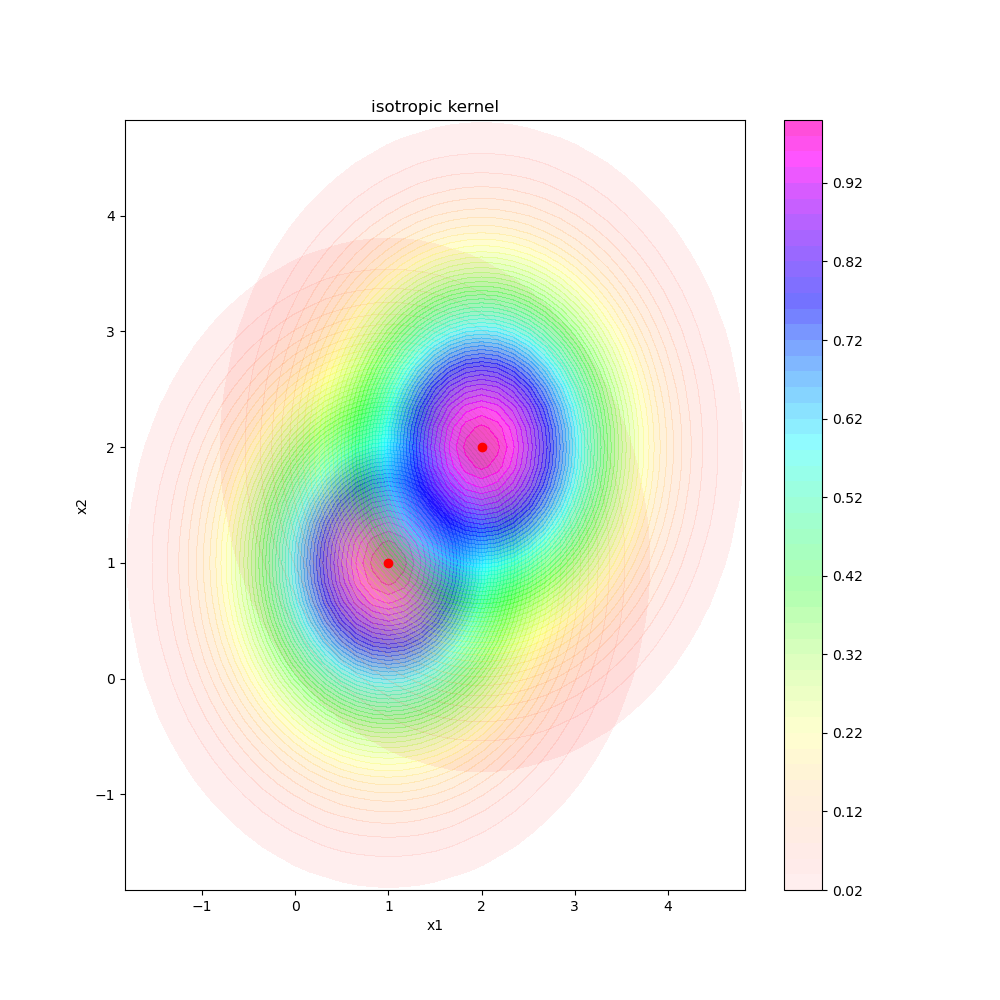
The code is dirty, but what I am doing is basically ploting 4 contourf plots In 2d plane, and blend them to show all of 4 contourf plots in one plane.
So I would appreciate if I set alpha of contourf less than 1, It shows underlying, previous contourf plot.
- And what I mean by my question is, 4 contour plots are visible indeed, but the contour color is the matter. It seems one contourf plot covers another previous drawn plot, even if I set its alpha < 1.
The behavior I expect is, two contourf color blend, so It seems semi-transparent.
If realised, It would be something like a feature of Photoshop’s layer blending mode.
Is there already a way to achieve this? Thanks!
(copied from github issue page : [ENH]: color blending mode · Issue #22513 · matplotlib/matplotlib · GitHub )