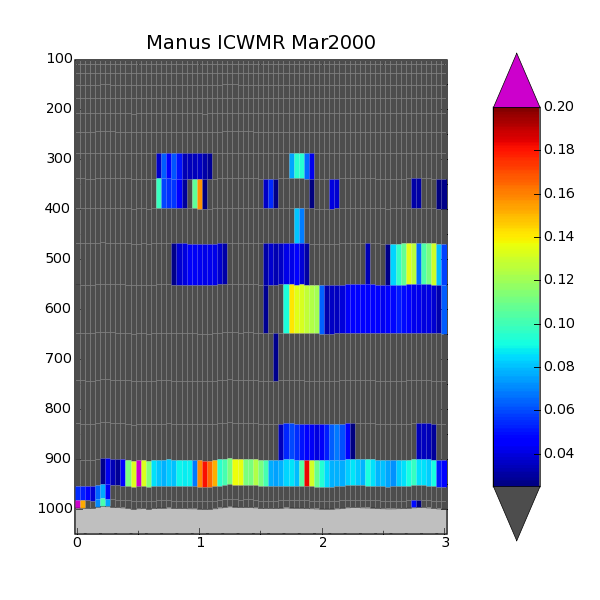
I have attached a figure (colorBarExample.png) that I hope everybody can see.
The figure is for data from a model whose gridbox size is a function of time and space. I have done a color fill using a color map (jet) and a
normalization. I use a collection of patches, each patch defines a polygon of the vertices of the gridbox and a color indexed to the value in that gridbox.
I have to modify the call to the colorbar so that it accepts this colormap and normalization.
For values outside the range of the max and min of the normalization, I have added filled triangles above and below the color bar.
This type of display is found in other visualization software. It allows the scale to just consider values of interest, while providing information as to the location and relative values of outliers.
I have also modified the colorbar code( in figure.py) to scale the width of the colorbar. I generate plots with aspect ratios of x axis long with respect to the y axis and in this situation the colorbar gets to be too fat.
The purpose of this long winded message is to advocate that the color bar code be modified to make this facility an option( ie specified color map, normalization, width scaling and end caps).
I am willing to do this myself - but I would need some help. Previously, John suggested that I make the routine that does the fill calls derive from ScalarMappable. This would make the colorbar color map and scaling come along naturally. My skill level is such that I have not been
able to get this to work - I am willing but not very able. My thought now is to make some substantial additions to colorbar.
--Jim
\