I have a - naive - code to calculate the coherence between two signals.
import numpy as np
import matplotlib.pyplot as plt
from scipy import signal
# Create sine wave1
timestep = 0.01
time = np.arange(0, 10, timestep)
freq = 10 # Hz
sinewave1 = np.sin(2.0 * np.pi * freq * time)
sinewave1 += 0.9*time;
# Create sine wave2
sinewave2 = np.sin(2.0 * np.pi * freq * time)
sinewave2 += -1.2*time;
# Plot the sine waves
plt.subplot(211)
plt.grid(True, which='both')
plt.xlabel('time')
plt.ylabel('amplitude')
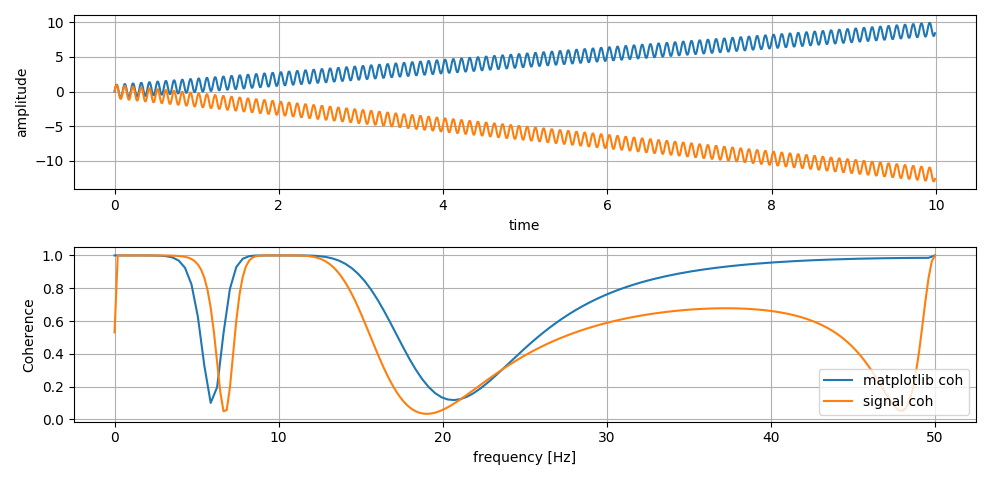
plt.plot(time, sinewave1, time, sinewave2)
# Plot the coherences
plt.subplot(212)
coh, f = plt.cohere(sinewave1, sinewave2, 256, 1./timestep, label="matplotlib coh")
plt.xlabel('frequency [Hz]')
plt.ylabel('coherence')
f, Cxy = signal.coherence(sinewave1, sinewave2, 1./timestep, nperseg=512)
plt.plot(f, Cxy, label="signal coh")
plt.legend(loc="lower right")
plt.show()
I would expect a peak at 10Hz in the coherence plots but instead I get these strange curves. Could anyone tell me what I am doing wrong or forward me to information that could instruct me?