This code is adapted from the contourf demo:
import matplotlib.pyplot as plt
import numpy as np

delta = 0.025

x = y = np.arange(-3.0, 3.01, delta)
X, Y = np.meshgrid(x, y)
Z1 = np.exp(-X**2 - Y**2)
Z2 = np.exp(-(X - 1)**2 - (Y - 1)**2)
Z = (Z1 - Z2) * 2

nr, nc = Z.shape

fig2, ax2 = plt.subplots()
levels = [-1.5, -1, -0.5, 0, 0.5, 1]
CS3 = ax2.contourf(X, Y, Z, levels,
                   colors=('r', 'g', 'b'),
                   extend='both')

CS3.cmap.set_under('yellow')
CS3.cmap.set_over('cyan')

fig2.colorbar(CS3)

plt.savefig('test.png')
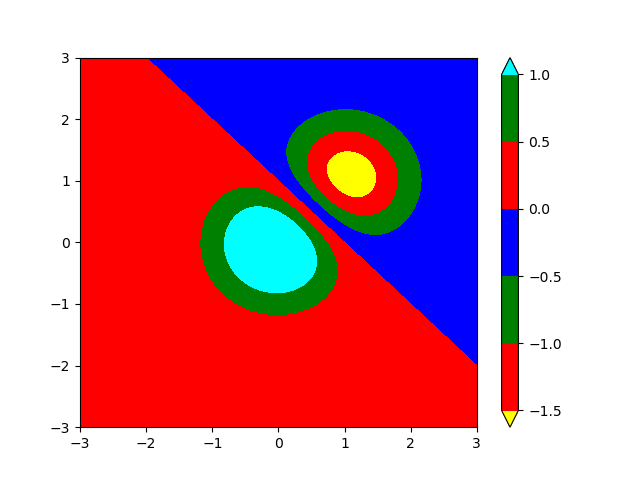
If I run this with an old environment (Matplotlib v3.3.4) I get the expected plot:
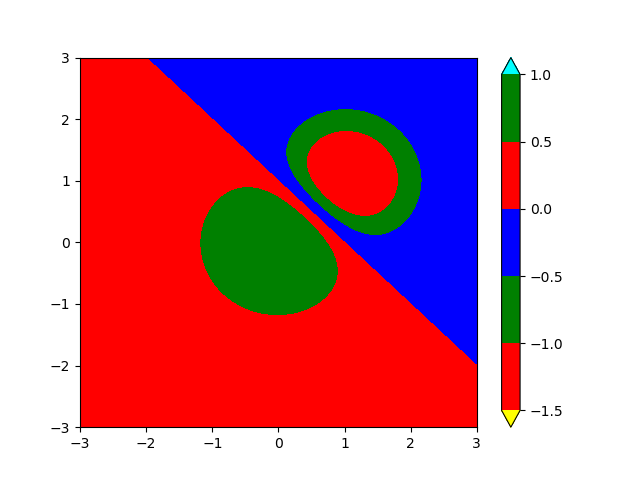
If I run with a newer environment (Matplotlib v3.6.2 onwards), the set_over and set_under do not affect the contours:
I have tried
export MATPLOTLIBRC=an_empty_fileto make sure the problem is not in my rcParams.- Creating a clean environment with
conda create -n matplotlib-clean matplotlib
But the new wrong behaviour persists. Any ideas? Clearly the old right behaviour works on whatever system generated the docs.