Sadly each keyword is handled manually in lib/matplotlib/contour.py L690 which is why you can set keywords which are completely ignored without getting any warning/exception.
We could add a set_clip_path keyword in that constructor, but in truth the whole keyword handling approach in contour.py could do with an overhaul.
Looking at it, we could equally add the appropriate method on the ContourSet object to control the clipping, which would just do the iteration over the collections as I did in my example.
···
On 2 September 2013 21:33, Alex Goodman <alex.goodman@…4442…> wrote:
Actually, sorry for the triple post, but is there a reason why we can’t do something like pass in the keyword arguments directly from the call to contourf when instantiating each collection? Then the keyword arguments for contourf (and ContourSet) could be used for the collections directly, including clip_path. I know a similar approach is taken for the keyword arguments in plot, since those can be used to modify the properties of each Line2D instance.
Thanks,
Alex
On Mon, Sep 2, 2013 at 1:09 PM, Alex Goodman <alex.goodman@…4444…> wrote:
Alex
Actually, it seems I have partially answered my own question. Since I am calling axis(‘off’), I do not notice the effect of clipping the other artists since I made a call to axis(‘off’). Without it the spines and axes rectangle are still removed but the ticks are still visible. I suppose this is fine for my own purposes of contouring within one country on a map since I would want to use something like axis(‘off’) anyway, but then it would not work if I wanted to use the axes background. Another approach I have tried is to use the clip_path keyword in the plotting functions themselves, which works for imshow and pcolor, but not contourf. Any other ideas?
–
Alex Goodman
Graduate Research Assistant
Department of Atmospheric Science
Colorado State University
On Mon, Sep 2, 2013 at 12:18 PM, Alex Goodman <alex.goodman@…4442…> wrote:
Hi Phil,
Thanks, that is more or less what I was looking for. However, I still think that generalizing this approach for other types of plotting functions that don’t return artists directly would be useful. Your solution gave me another idea for doing this, which would be to iterate through all of the child artists on the axes using the get_children() method and then calling set_clip_path() on each artist. This would make the methodology very general but I am not sure if there are any negative side effects to resetting the clip path on the other artists besides the PatchCollections. I modified my simple example script and it seems to work well for contourf(), pcolor(), and imshow():
import numpy as np
import matplotlib.pyplot as plt
from matplotlib.patches import RegularPolygon
data = np.arange(100).reshape(10, 10)
fig = plt.figure()
ax = fig.add_subplot(111)
ax.contourf(data)
poly = RegularPolygon([ 0.5, 0.5], 6, 0.4, fc=‘none’,
ec='k', transform=ax.transAxes)
for artist in ax.get_children():
artist.set_clip_path(poly)
ax.add_patch(poly)
ax.set_aspect(‘equal’)
ax.axis(‘off’)
plt.show()
Also, I appreciated the cartopy example. I think it has the potential to be a good basemap replacement thanks to the more robust shapefile support (which you have very elegantly shown), and I hope the development goes well.
Thanks,
Alex
–
Alex Goodman
Graduate Research Assistant
Department of Atmospheric Science
Colorado State University
On Mon, Sep 2, 2013 at 2:33 AM, Phil Elson <pelson.pub@…287…> wrote:
Great question. The contour set itself does not have a set_clip_path method but you can iterate over each of the contour collections and set their respective clip paths, i.e.:
cs = plt.contourf(data)
for collection in cs.collections:
collection.set_clip_path(poly)
Of course, you can use this approach in either Basemap or cartopy, but I’ve put together an example of doing it in cartopy to demonstrate the neat Shapely integration: http://nbviewer.ipython.org/6410510
HTH,
Phil
–
Alex Goodman
Graduate Research Assistant
Department of Atmospheric Science
Colorado State University
On 2 September 2013 05:40, Alex Goodman <alex.goodman@…4442…> wrote:
Hi all,
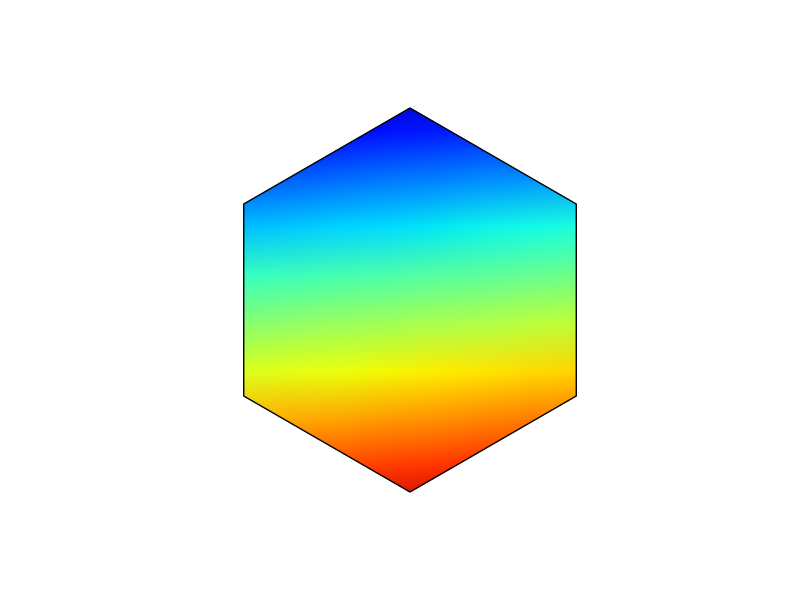
I want to be able to plot data on maps (using basemap or cartopy) inside specific regions, eg a single state, province or country. A similar question was asked a long time ago on the mailing list and the suggested solution back then was to read the bounding polygon from a shapefile and then check if each individual point was inside that polygon. Currently I have no problem doing this if I use matplotlib.path.Path.contains_points() to mask the original data array, but the disadvantage to this solution is that it is very slow. Another solution that I have discovered recently is to use the set_clip_path() method for artists. In addition to being much faster, this also makes the areas near the polygon boundary look much smoother since the actual items being clipped are individual pixels and not data points.
Here is an example script that plots an image via imshow, but the only part of the image that gets shown is inside the hexagon.
import numpy as np
import matplotlib.pyplot as plt
from matplotlib.patches import RegularPolygon
data = np.arange(100).reshape(10, 10)
fig = plt.figure()
ax = fig.add_subplot(111)
im = ax.imshow(data)
poly = RegularPolygon([ 0.5, 0.5], 6, 0.4, fc=‘none’,
ec='k', transform=ax.transAxes)
im.set_clip_path(poly)
ax.add_patch(poly)
ax.axis(‘off’)
plt.show()
While this does seem like an ideal solution, it doesn’t work for every type of plot. The most notable example is contourf(). It returns a QuadContourSet instance which does not inherit from Artist, so it does not contain the set_clip_path() method. My main question is whether there is a mechanism in matplotlib that can convert something like a QuadContourSet into an image so I can make use of this solution for contourf() as well. Or better yet, is there perhaps another artist within the axes that I can use the set_clip_path() method for and still get what I want?
Thanks,
Alex
Alex Goodman
Graduate Research Assistant
Department of Atmospheric Science
Colorado State University
–
Learn the latest–Visual Studio 2012, SharePoint 2013, SQL 2012, more!
Discover the easy way to master current and previous Microsoft technologies
and advance your career. Get an incredible 1,500+ hours of step-by-step
tutorial videos with LearnDevNow. Subscribe today and save!
http://pubads.g.doubleclick.net/gampad/clk?id=58040911&iu=/4140/ostg.clktrk
Matplotlib-users mailing list
[email protected]
https://lists.sourceforge.net/lists/listinfo/matplotlib-users