Hello,
I'm in the process of migrating some software I've written from a
machine with MPL 0.86.2 on it to another with 0.87.2 .
The app is Qt-based with MPL embedded as a widget. The plot itself uses
dates on the x-axis.
It appears that the behavior of autoscale_view() changed quite a bit
somewhere between these two versions.
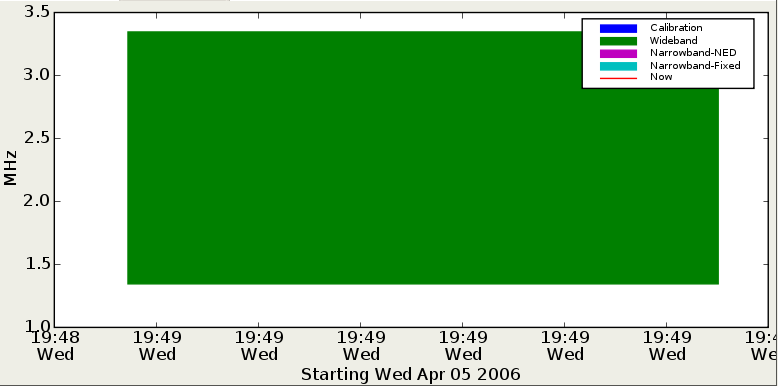
In my application I create a patches.Rectangle that is 100 seconds wide:
start_time_num = matplotlib.dates.date2num( start_time )
lower_left = [ matplotlib.dates.date2num( start_time ), start_y ]
width = matplotlib.dates.date2num( start_time + datetime.timedelta( seconds=10 ) ) - start_time_num
r = matplotlib.patches.Rectangle( lower_left, width, height )
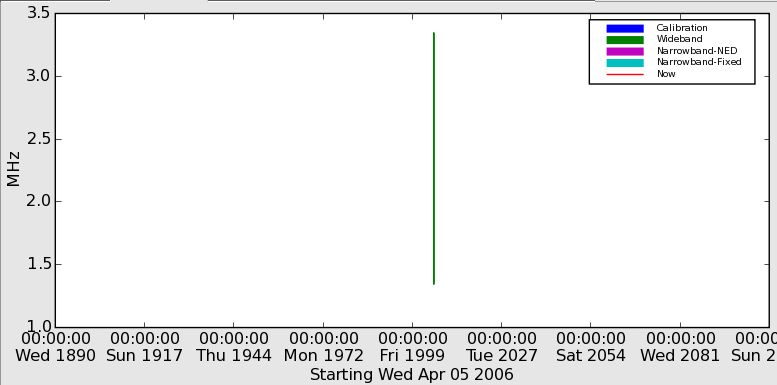
With the 0.86.2 version, the total span of the x-axis after an
autoscale_view() call is about 12 seconds. For the 0.87.2 version
however, the span is more than 200 years. (see attached .png files)
I don't see this type of behavior in the pylab environment, yet I'm
having a hard time creating a concise example that demonstrates the
behavior.
I can keep working on extracting an snippet, but I thought I'd ask
if this is some intended behavioral change, and if so, if there is a
workaround.
Thank you!
Glen Mabey