Is there a way to get TwoSlopeNorm working in combination with logarithmic scaling in base 2 on the colorbar?
An example is something like this where you have normal linear scaling:
import matplotlib.pyplot as plt
import matplotlib.colors
import numpy as np

x = np.arange(-50,100,1)
y = x.copy()
c = x.copy()
scatter_plot = plt.scatter(x, y, c=c, cmap='bwr', norm=matplotlib.colors.TwoSlopeNorm(vmin=-50, vcenter=0, vmax=100))
cbar = plt.colorbar(scatter_plot)
plt.show()
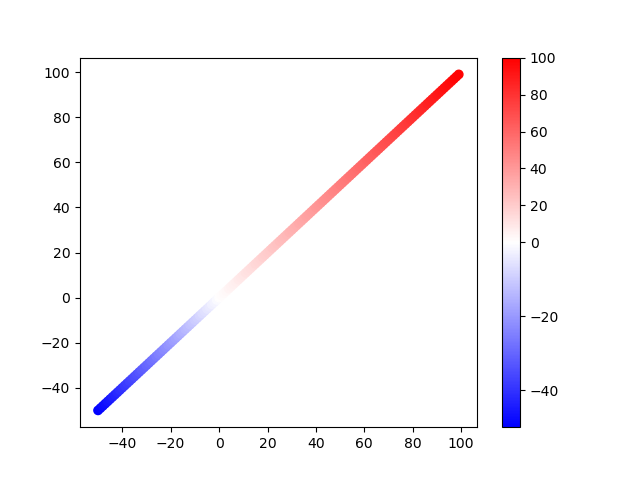
I am aware that base2 does not make much sense for this particular example, but it should simply illustrate what I am talking about.
I know that SymLogNorm supports base2, but it looks like this is not the case for TwoSlopeNorm. Does anyone have a suggestion on how to do it?
PS: I noticed a small error on the main website.
The gitter-icon in the header links to https://gitter.im/matplotlib , which results in an error.
The icon on the bottom correctly links to https://gitter.im/matplotlib/matplotlib