Though with a little hacking, you can emulate it by manually drawing
everything yourself -- this is the approach SAGE takes. Eg,
import numpy as np
from pylab import figure, show
import matplotlib.lines as lines
def make_xaxis(ax, yloc, offset=0.05, **props):
xmin, xmax = ax.get_xlim()
locs = [loc for loc in ax.xaxis.get_majorticklocs()
if loc>=xmin and loc<=xmax]
tickline, = ax.plot(locs, [yloc]*len(locs),linestyle='',
marker=lines.TICKDOWN, **props)
axline, = ax.plot([xmin, xmax], [yloc, yloc], **props)
tickline.set_clip_on(False)
axline.set_clip_on(False)
for loc in locs:
ax.text(loc, yloc-offset, '%1.1f'%loc,
horizontalalignment='center',
verticalalignment='top')
def make_yaxis(ax, xloc=0, offset=0.05, **props):
ymin, ymax = ax.get_ylim()
locs = [loc for loc in ax.yaxis.get_majorticklocs()
if loc>=ymin and loc<=ymax]
tickline, = ax.plot([xloc]*len(locs), locs, linestyle='',
marker=lines.TICKLEFT, **props)
axline, = ax.plot([xloc, xloc], [ymin, ymax], **props)
tickline.set_clip_on(False)
axline.set_clip_on(False)
for loc in locs:
ax.text(xloc-offset, loc, '%1.1f'%loc,
verticalalignment='center',
horizontalalignment='right')
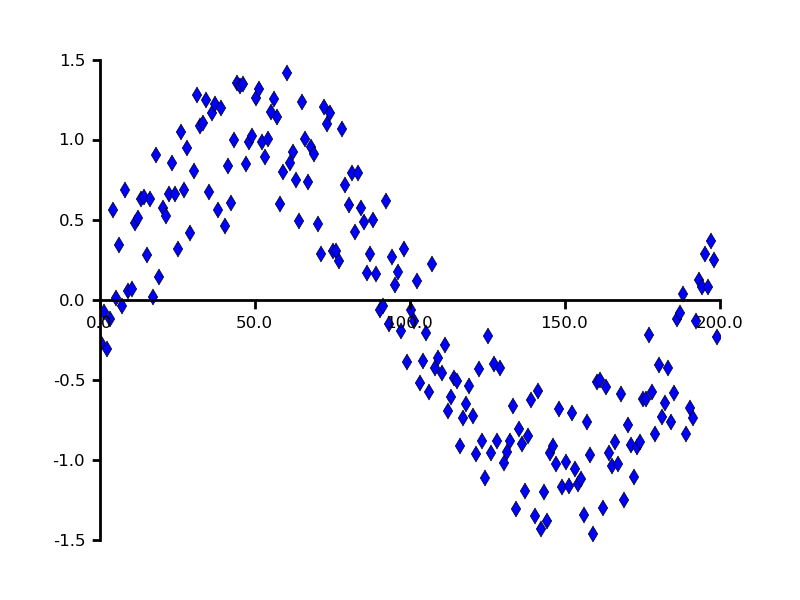
props = dict(color='black', linewidth=2, markeredgewidth=2)
x = np.arange(200.)
y = np.sin(2*np.pi*x/200.) + np.random.rand(200)-0.5
fig = figure(facecolor='white')
ax = fig.add_subplot(111, frame_on=False)
ax.axison = False
ax.plot(x, y, 'd', markersize=8, markerfacecolor='blue')
ax.set_xlim(0, 200)
ax.set_ylim(-1.5, 1.5)
make_xaxis(ax, 0, offset=0.1, **props)
make_yaxis(ax, 0, offset=5, **props)
fig.savefig('manual_axis.png', dpi=100, facecolor='white', edgecolor='white')
show()
test.py (1.65 KB)
···
On Feb 2, 2008 3:06 PM, Eric Firing <efiring@...202...> wrote:
volcs0 wrote:
> I saw one post related to arbitrary axis positioning from 2005, but there was
> no solution.
It is still on the wish list.