Matplotlib is weak in handling automatic ticks and tick labels with log scale axes. I refuse to use the complicated
mticker
and resort instead to the much simpler
yticks = …
yticklabels = [str(yt) for yt in yticks]
plt.yticks(yticks)
plt.gca().set_yticklabels(yticklabels)
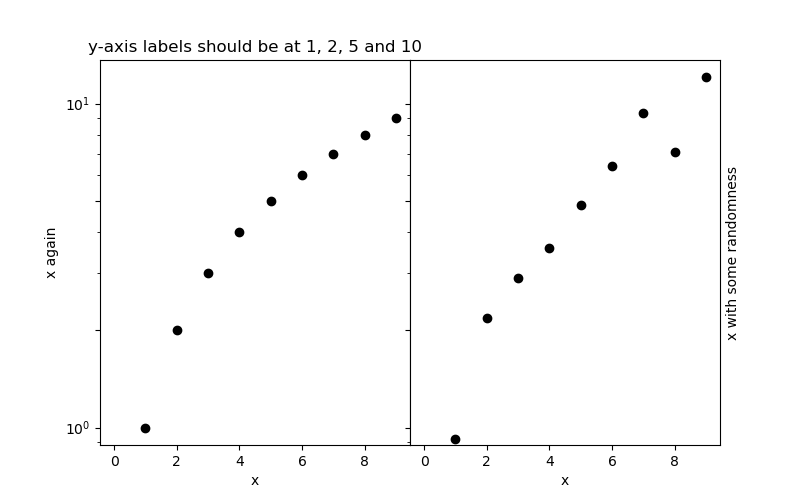
This works OK (especially in a function I created), except when I use subplots with shared axes. Here is an example.
from matplotlib import pyplot as plt
import numpy as np
x = np.arange(0,10)
y0 = x
y1 = x * (1+0.2*np.random.randn(10))
fig, ax = plt.subplots(1,2,sharey=True,squeeze=True,figsize=[8,5])
plt.subplots_adjust(wspace=0)
ax[0].scatter(x,y0,c=‘k’)
ax[0].set_xlabel(‘x’)
ax[0].set_ylabel(‘x’)
ax[0].set_yscale(‘log’)
yticks = [1,2,5,10]
yticklabels = [str(yt) for yt in yticks]
ax[0].set_yticks(yticks)
ax[0].set_yticklabels(yticklabels)
ax[0].set_title(‘y-axis labels should be at 1, 2, 5 and 10’)
ax[1].scatter(x,y1,c=‘k’)
ax[1].set_xlabel(‘x again’)
ax[1].set_ylabel(‘x with some randomness’)
ax[1].yaxis.set_label_position(‘right’)
ax[1].set_yscale(‘log’)
ax[1].set_yticks(yticks)
The output shows large taxis ticks at the desired positions, but the y-axis labels are only displayed at 0.1, 1, 10, whereas they were requested at closer spacings. This seems to me to be a bug. It goes away if
sharey=True
is removed. In this example, I removed my matplotlibrc file before making the figure.
Is this bug easy to fix?
Python 3.9.16
Matplotlib 3.7.0
MacOS 13.6.1