Hi folks,
it seems to me that there is a bug in scatter when using log scale. Have a look at the output of the following script:
from pylab import *
print matplotlib.version
x=arange(10)
plot(x, exp(-x))
ax=gca()
ax.set_yscale(‘log’)
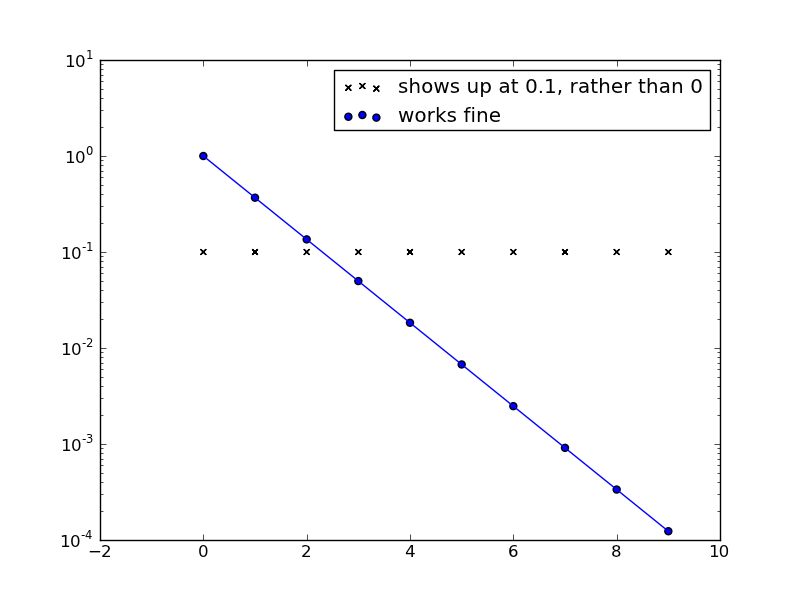
scatter(x, exp(-x), label= ‘works fine’)
scatter(x, zeros(10), marker=‘x’, label=‘shows up at 0.1, rather than 0’)
legend()
savefig(‘scatter_bug.png’)
On my machine, scatter puts zeros on the logscale somewhere at 0.1, where they aren’t supposed to be.
thanks a lot,
richard
The verbose output:
$HOME=/Users/richard
CONFIGDIR=/Users/richard/.matplotlib
matplotlib data path /Library/Frameworks/EPD64.framework/Versions/7.0/lib/python2.7/site-packages/matplotlib/mpl-data
loaded rc file /Library/Frameworks/EPD64.framework/Versions/7.0/lib/python2.7/site-packages/matplotlib/mpl-data/matplotlibrc
matplotlib version 1.0.1
verbose.level helpful
interactive is False
units is False
platform is darwin
Using fontManager instance from /Users/richard/.matplotlib/fontList.cache
backend MacOSX version unknown
1.0.1
The resulting figure:
Hi Richard,
I've submitted this a while ago to the mailing list [1] as well, but
nobody answered.  Hopefully, somebody knows an answer this time.
- Marcel

[1]
···
http://www.mail-archive.com/matplotlib-users@lists.sourceforge.net/msg20684.html
Hi folks,
it seems to me that there is a bug in scatter when using log
scale. Have a look at the output of the following script:
from pylab import
*
print
matplotlib.version
x=arange(10)
plot(x, exp(-x))
ax=gca()
ax.set_yscale(‘log’)
scatter(x, exp(-x), label= ‘works fine’)
scatter(x, zeros(10 ),
marker=‘x’, label=‘shows up at 0.1, rather than 0’)
legend()
savefig(‘scatter_bug.png’)
On my machine, scatter puts zeros on the logscale somewhere
at 0.1, where they aren’t supposed to be.
thanks a lot,
richard
The verbose output:
$HOME=/Users/richard
CONFIGDIR=/Users/richard/.matplotlib
matplotlib data path
/Library/Frameworks/EPD64.framework/Versions/7.0/lib/python2.7/site-packages/matplotlib/mpl-data
loaded rc file
/Library/Frameworks/EPD64.framework/Versions/7.0/lib/python2.7/site-packages/matplotlib/mpl-data/matplotlibrc
matplotlib version 1.0.1
verbose.level helpful
interactive is False
units is False
platform is darwin
Using fontManager instance from
/Users/richard/.matplotlib/fontList.cache
backend MacOSX version unknown
1.0.1
The resulting figure:
------------------------------------------------------------------------------
Get a FREE DOWNLOAD! and learn more about uberSVN rich system, user administration capabilities and model configuration. Take the hassle out of deploying and managing Subversion and the tools developers use with it.
_______________________________________________
Matplotlib-users mailing list
http://p.sf.net/sfu/wandisco-d2d-2Matplotlib-users@lists.sourceforge.nethttps://lists.sourceforge.net/lists/listinfo/matplotlib-users
Hi folks,
it seems to me that there is a bug in scatter when using log scale. Have
a look at the output of the following script:
frompylab import*
print matplotlib.__version__
x=arange(10)
plot(x, exp(-x))
ax=gca()
ax.set_yscale('log')
scatter(x, exp(-x), label= 'works fine')
scatter(x, zeros(10), marker='x', label='shows up at 0.1, rather than 0')
legend()
savefig('scatter_bug.png')
On my machine, scatter puts zeros on the logscale somewhere at 0.1,
where they aren't supposed to be.
I agree that this is a bug. (I suspect it is a malign side-effect of some attempt to make bar plots work with a log scale, but I haven't tracked it down.) What is less clear is the desired behavior. Raise an exception? Silently delete the points that are invalid with a log scale? Or delete them with a warning?
Eric
···
On 08/18/2011 10:03 PM, Richard Neher wrote:
thanks a lot,
richard
The verbose output:
$HOME=/Users/richard
CONFIGDIR=/Users/richard/.matplotlib
matplotlib data path
/Library/Frameworks/EPD64.framework/Versions/7.0/lib/python2.7/site-packages/matplotlib/mpl-data
loaded rc file
/Library/Frameworks/EPD64.framework/Versions/7.0/lib/python2.7/site-packages/matplotlib/mpl-data/matplotlibrc
matplotlib version 1.0.1
verbose.level helpful
interactive is False
units is False
platform is darwin
Using fontManager instance from /Users/richard/.matplotlib/fontList.cache
backend MacOSX version unknown
1.0.1
The resulting figure:
------------------------------------------------------------------------------
Get a FREE DOWNLOAD! and learn more about uberSVN rich system,
user administration capabilities and model configuration. Take
the hassle out of deploying and managing Subversion and the
tools developers use with it. http://p.sf.net/sfu/wandisco-d2d-2
_______________________________________________
Matplotlib-users mailing list
Matplotlib-users@lists.sourceforge.net
matplotlib-users List Signup and Options
I agree that this is a bug. (I suspect it is a malign side-effect of
some attempt to make bar plots work with a log scale, but I haven't
tracked it down.) What is less clear is the desired behavior. Raise an
exception? Silently delete the points that are invalid with a log scale?
Or delete them with a warning?
I would delete them with a warning. Those who are familiar with logs will not be surprised. Those who are not familiar will be provided an opportunity to learn something new!
Andre
···
Eric
thanks a lot,
richard
The verbose output:
$HOME=/Users/richard
CONFIGDIR=/Users/richard/.matplotlib
matplotlib data path
/Library/Frameworks/EPD64.framework/Versions/7.0/lib/python2.7/site-packages/matplotlib/mpl-data
loaded rc file
/Library/Frameworks/EPD64.framework/Versions/7.0/lib/python2.7/site-packages/matplotlib/mpl-data/matplotlibrc
matplotlib version 1.0.1
verbose.level helpful
interactive is False
units is False
platform is darwin
Using fontManager instance from /Users/richard/.matplotlib/fontList.cache
backend MacOSX version unknown
1.0.1
The resulting figure:
------------------------------------------------------------------------------
Get a FREE DOWNLOAD! and learn more about uberSVN rich system,
user administration capabilities and model configuration. Take
the hassle out of deploying and managing Subversion and the
tools developers use with it. http://p.sf.net/sfu/wandisco-d2d-2
_______________________________________________
Matplotlib-users mailing list
Matplotlib-users@lists.sourceforge.net
matplotlib-users List Signup and Options
I agree that this is a bug. (I suspect it is a malign side-effect of
some attempt to make bar plots work with a log scale, but I haven't
tracked it down.) What is less clear is the desired behavior. Raise an
exception? Silently delete the points that are invalid with a log scale?
Or delete them with a warning?
I would delete them with a warning. Those who are familiar with logs will not be surprised. Those who are not familiar will be provided an opportunity to learn something new!
I have tracked down the problem, and am testing a fix for it. The intended behavior was silent masking of non-positive values. An option for a warning could be added, but for now I will just make it work as intended, and as it does with other plot types.
Eric
···
On 08/19/2011 09:19 AM, Andre' Walker-Loud wrote:
Andre
Eric
thanks a lot,
richard
The verbose output:
$HOME=/Users/richard
CONFIGDIR=/Users/richard/.matplotlib
matplotlib data path
/Library/Frameworks/EPD64.framework/Versions/7.0/lib/python2.7/site-packages/matplotlib/mpl-data
loaded rc file
/Library/Frameworks/EPD64.framework/Versions/7.0/lib/python2.7/site-packages/matplotlib/mpl-data/matplotlibrc
matplotlib version 1.0.1
verbose.level helpful
interactive is False
units is False
platform is darwin
Using fontManager instance from /Users/richard/.matplotlib/fontList.cache
backend MacOSX version unknown
1.0.1
The resulting figure: