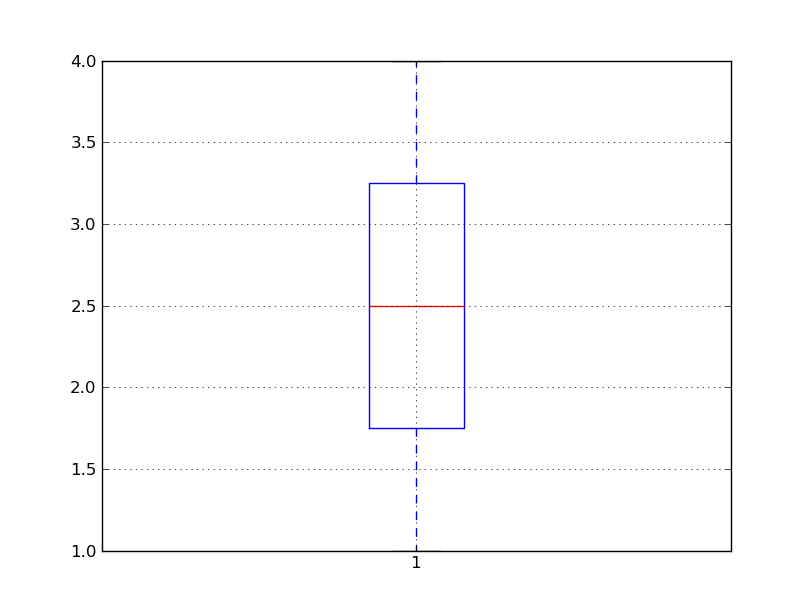
I noticed that the boxplot function incorrectly calculates the
location of the median line in each box. As a simple example, plotting
the dataset [1, 2, 3, 4] incorrectly plots the median line at 3.
It also seems that the quartile calculations for the box are a
little peculiar. I have seen some discussion in old mailing list
postings about mlab.prctile and its ways of calculating percentiles,
which are different than those of some other software.
I'm aware that there is legitimate disagreement about the "best"
way to calculate the quartiles. However, it seems to me that mlab's way
is still not any of these possibly-correct ways, because it uses int()
or nparray.astype(int) to coerce the percentile result to an integer
index. This TRUNCATES the floating-point result. No accepted quantile-
calculating method that I'm aware of does this; they all ROUND instead
of truncating (if they want to coerce to an integer index at all, in
order to produce a quantile value that is an element of the data set),
or in some cases they round uniformly up for the lower quartile and
down for the upper. You can see a summary of different methods at
http://www.amstat.org/publications/jse/v14n3/langford.html ; the method
used by mlab does not appear to agree with any of these.
I would suggest that mlab.prctile be fixed to conform to some one
or other of these methods, rather than adding to the proliferation of
approaches to quantile-calculation. Is there any motivation for always
truncating to integer (other that "it's quicker to type" :-)?
Also, regardless of these quartile issues, there is, as far as I'm
aware, no one who denies that the median of a (sorted) data set with an
even number of values is the mean of the middle two values. Since numpy
is already a dependency for matplotlib, boxplot shouldn't use
mlab.prctile at all to decide where to plot the median line -- just use
numpy.median.
Thanks,
···
--
--OKB (not okblacke)
Brendan Barnwell
"Do not follow where the path may lead. Go, instead, where there is
no path, and leave a trail."
--author unknown