Hi, when I use the function "contour" sometimes I get a broken contour line. This should be continuous. Probably this is a bug. Does anyone know anything about this issue?
Regards,
Ozgur
Hi, when I use the function "contour" sometimes I get a broken contour line. This should be continuous. Probably this is a bug. Does anyone know anything about this issue?
Regards,
Ozgur
Could you please post an image of what you are seeing, and possibly the data used to create this? Also, which version of mpl are you using?
Ben Root
On Saturday, August 13, 2011, Özgür <ozgur.erken@…3727…> wrote:
Hi, when I use the function “contour” sometimes I get a broken contour
line. This should be continuous. Probably this is a bug. Does anyone know
anything about this issue?
Regards,
Ozgur
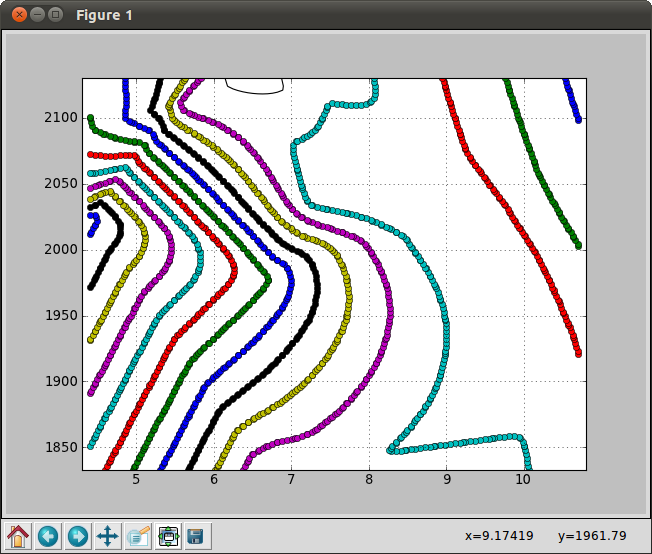
Please forget it. For now the real problem is: I am plotting by using "contour" and I get the data values by using get_paths. But it does not include some part of the contour. A screenshot is attached. The colored lines are those returned by get_paths. But the black line is not included. I guess this is a bug?
contour = plt.contour(xi,yi,zi,numberoflevels,linewidths=1,colors='k')
lev = contour.levels
col = contour.collections
polygons =
for i in range(len(lev)):
polygons.append (col[i].get_paths()[0].vertices)
... other code to plot the colored points...
On Sat, 13 Aug 2011, �zg�r wrote:
Hi, when I use the function "contour" sometimes I get a broken contour
line. This should be continuous. Probably this is a bug. Does anyone know
anything about this issue?Regards,
Ozgur------------------------------------------------------------------------------
FREE DOWNLOAD - uberSVN with Social Coding for Subversion.
Subversion made easy with a complete admin console. Easy
to use, easy to manage, easy to install, easy to extend.
Get a Free download of the new open ALM Subversion platform now.
http://p.sf.net/sfu/wandisco-dev2dev
_______________________________________________
Matplotlib-users mailing list
Matplotlib-users@lists.sourceforge.net
matplotlib-users List Signup and Options
You are assuming that there are the same number of contours as levels. In the general case, this can never be assumed. Why not just simply loop over the collections(or, even better, use a list comprehension)?
Ben Root
On Saturday, August 13, 2011, Özgür <ozgur.erken@…3727…> wrote:
Please forget it. For now the real problem is: I am plotting by using “contour” and I get the data values by using get_paths. But it does not include some part of the contour. A screenshot is attached. The colored lines are those returned by get_paths. But the black line is not included. I guess this is a bug?
contour = plt.contour(xi,yi,zi,numberoflevels,linewidths=1,colors=‘k’)
lev = contour.levels
col = contour.collections
polygons =
for i in range(len(lev)):
polygons.append (col[i].get_paths()[0].vertices)
… other code to plot the colored points…
I guess that is the problem. Thanks for the idea.
Regards, Ozgur
On Sat, 13 Aug 2011, Benjamin Root wrote:
On Saturday, August 13, 2011, �zg�r <ozgur.erken@...3727...> wrote:
> Please forget it. For now the real problem is: I am plotting by using "contour" and I get the data values by using get_paths. But
it does not include some part of the contour. A screenshot is attached. The colored lines are those returned by get_paths. But the
black line is not included. I guess this is a bug?
>
> contour = plt.contour(xi,yi,zi,numberoflevels,linewidths=1,colors='k')
> lev = contour.levels
> col = contour.collections
> polygons =
> for i in range(len(lev)):
> � � � �polygons.append (col[i].get_paths()[0].vertices)
>
> ... other code to plot the colored points...
>You are assuming that there are the same number of contours as levels. �In the general case, this can never be assumed. �Why not
just simply loop over the collections(or, even better, use a list comprehension)?Ben Root