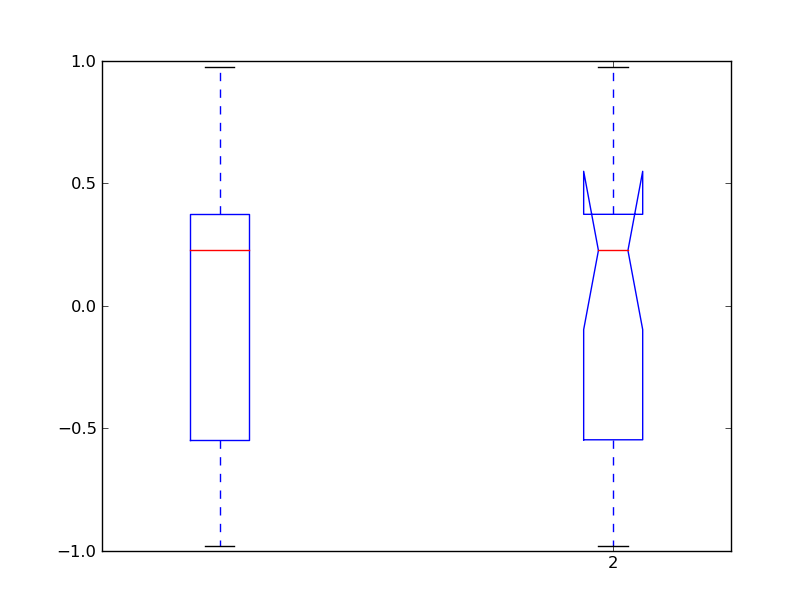
I found an inconsistency with how boxplots are rendered between version 0.99.1 and the svn head. See attached images. I have never seen a boxplot cross back on itself like this before. Is this the expected behavior?
Thanks,
-Ben
Ben Axelrod
Robotics Engineer
(800) 641-2676 x737

www.coroware.com
www.corobot.net
boxbug.py (485 Bytes)
Hi - more generally, is there any way to control the location of the median line, the vertical size of the box and the vertical location of the whiskers?
Thanks - Ariel
···
On Tue, Feb 23, 2010 at 11:32 AM, <PHobson@…2850…> wrote:
~~~~~~~~~~~~~~~~~~~
From: Ben Axelrod [mailto:BAxelrod@…120…2066…]
Sent: Tuesday, February 23, 2010 9:31 AM
To: matplotlib-users@lists.sourceforge.net
Subject: [Matplotlib-users] boxplot bug
I found an inconsistency with how boxplots are rendered between version 0.99.1 and the svn head. See attached images. I have never seen a boxplot cross back on itself like this before. Is this the expected behavior?
Thanks,
-Ben
~~~~~~~~~~~~~~~~~~~~
Ben,
Yes it is expected behavior. Confidence intervals around the median can easily go beyond the 1st and 3rd quartiles. If you’re not comfortable with this, throw the data into R. I’m confident you’ll get a similar result. I believe (not sure) that in the svn version you can specify that the CIs be computed from a bootstrapped median. Doing so might tighten the CIs up a bit.
-Paul H.
Download Intel® Parallel Studio Eval
Try the new software tools for yourself. Speed compiling, find bugs
proactively, and fine-tune applications for parallel performance.
See why Intel Parallel Studio got high marks during beta.
http://p.sf.net/sfu/intel-sw-dev
Matplotlib-users mailing list
Matplotlib-users@lists.sourceforge.net
https://lists.sourceforge.net/lists/listinfo/matplotlib-users
–
Ariel Rokem
Helen Wills Neuroscience Institute
University of California, Berkeley
http://argentum.ucbso.berkeley.edu/ariel
Aren’t those generically calculated from the data?
···
On Tue, Feb 23, 2010 at 3:02 PM, Ariel Rokem <arokem@…1836…016…> wrote:
Hi - more generally, is there any way to control the location of the median line, the vertical size of the box and the vertical location of the whiskers?
Thanks - Ariel
–
Gökhan
Hi -
yes - but I want something that looks like the generic boxplot, but in which I can control where the edges of the boxes are placed what the sizes of the whiskers are. A combination of errorbar and bar, with this appearance, if you will.
Cheers - Ariel
···
On Tue, Feb 23, 2010 at 2:49 PM, Gökhan Sever <gokhansever@…287…> wrote:
On Tue, Feb 23, 2010 at 3:02 PM, Ariel Rokem <arokem@…1016…> wrote:
Hi - more generally, is there any way to control the location of the median line, the vertical size of the box and the vertical location of the whiskers?
Thanks - Ariel
Aren’t those generically calculated from the data?
–
Gökhan
–
Ariel Rokem
Helen Wills Neuroscience Institute
University of California, Berkeley
http://argentum.ucbso.berkeley.edu/ariel
Hi -
yes - but I want something that looks like the generic boxplot, but in which I can control where the edges of the boxes are placed what the sizes of the whiskers are. A combination of errorbar and bar, with this appearance, if you will.
Cheers - Ariel
I guess then yours will be a non-standard box-plot because in a regular boxplot median is at 50th percentile, and the edges are at 25 and 75th respectively. There is no consensus for whiskers some uses 5 and 95 some 10 - 90 or you could come up with your own pair. Don’t get surprised if you see different results for different percentiles. See at http://old.nabble.com/incorrect-boxplot–td25440025.html
Probably you don’t seek something like boxplot’s widths kw arg if I understand you right?
···
On Tue, Feb 23, 2010 at 5:04 PM, Ariel Rokem <arokem@…1016…> wrote:
On Tue, Feb 23, 2010 at 2:49 PM, Gökhan Sever <gokhansever@…287…> wrote:
On Tue, Feb 23, 2010 at 3:02 PM, Ariel Rokem <arokem@…1016…> wrote:
Hi - more generally, is there any way to control the location of the median line, the vertical size of the box and the vertical location of the whiskers?
Thanks - Ariel
Aren’t those generically calculated from the data?
–
Gökhan
–
Ariel Rokem
Helen Wills Neuroscience Institute
University of California, Berkeley
http://argentum.ucbso.berkeley.edu/ariel
–
Gökhan
No - not the ‘widths’ kwarg. I want something that looks like the boxplot, but for which I will have control of setting the ranges delimited by the box and delimited by the whiskers (in the vertical dimension, not the horizontal dimension). I resorted to hacking something from the existing code (see attached diff). This simply allows you to over-ride the computation of box_y, med_y and the wisk_lo and wisk_hi, which are otherwise derived from the data. In other words, it allows you to ignore the data 
Cheers - Ariel
box_plot_diff.diff (5.72 KB)
···
On Tue, Feb 23, 2010 at 3:15 PM, Gökhan Sever <gokhansever@…287…> wrote:
On Tue, Feb 23, 2010 at 5:04 PM, Ariel Rokem <arokem@…1016…> wrote:
Hi -
yes - but I want something that looks like the generic boxplot, but in which I can control where the edges of the boxes are placed what the sizes of the whiskers are. A combination of errorbar and bar, with this appearance, if you will.
Cheers - Ariel
I guess then yours will be a non-standard box-plot because in a regular boxplot median is at 50th percentile, and the edges are at 25 and 75th respectively. There is no consensus for whiskers some uses 5 and 95 some 10 - 90 or you could come up with your own pair. Don’t get surprised if you see different results for different percentiles. See at http://old.nabble.com/incorrect-boxplot–td25440025.html
Probably you don’t seek something like boxplot’s widths kw arg if I understand you right?
On Tue, Feb 23, 2010 at 2:49 PM, Gökhan Sever <gokhansever@…287…> wrote:
On Tue, Feb 23, 2010 at 3:02 PM, Ariel Rokem <arokem@…1016…> wrote:
Hi - more generally, is there any way to control the location of the median line, the vertical size of the box and the vertical location of the whiskers?
Thanks - Ariel
Aren’t those generically calculated from the data?
–
Gökhan
–
Ariel Rokem
Helen Wills Neuroscience Institute
University of California, Berkeley
http://argentum.ucbso.berkeley.edu/ariel
–
Gökhan
–
Ariel Rokem
Helen Wills Neuroscience Institute
University of California, Berkeley
http://argentum.ucbso.berkeley.edu/ariel
Probably this change would upset John Tukey if he were alive.
I still wonder how you ignore the data since boxplot is there to represent the data
Tell me how to undiff the changes then I will test your idea.
···
On Wed, Feb 24, 2010 at 12:03 AM, Ariel Rokem <arokem@…83…1016…> wrote:
No - not the ‘widths’ kwarg. I want something that looks like the boxplot, but for which I will have control of setting the ranges delimited by the box and delimited by the whiskers (in the vertical dimension, not the horizontal dimension). I resorted to hacking something from the existing code (see attached diff). This simply allows you to over-ride the computation of box_y, med_y and the wisk_lo and wisk_hi, which are otherwise derived from the data. In other words, it allows you to ignore the data
Cheers - Ariel
On Tue, Feb 23, 2010 at 3:15 PM, Gökhan Sever <gokhansever@…287…> wrote:
On Tue, Feb 23, 2010 at 5:04 PM, Ariel Rokem <arokem@…1016…> wrote:
Hi -
yes - but I want something that looks like the generic boxplot, but in which I can control where the edges of the boxes are placed what the sizes of the whiskers are. A combination of errorbar and bar, with this appearance, if you will.
Cheers - Ariel
I guess then yours will be a non-standard box-plot because in a regular boxplot median is at 50th percentile, and the edges are at 25 and 75th respectively. There is no consensus for whiskers some uses 5 and 95 some 10 - 90 or you could come up with your own pair. Don’t get surprised if you see different results for different percentiles. See at http://old.nabble.com/incorrect-boxplot–td25440025.html
Probably you don’t seek something like boxplot’s widths kw arg if I understand you right?
On Tue, Feb 23, 2010 at 2:49 PM, Gökhan Sever <gokhansever@…287…> wrote:
On Tue, Feb 23, 2010 at 3:02 PM, Ariel Rokem <arokem@…1016…> wrote:
Hi - more generally, is there any way to control the location of the median line, the vertical size of the box and the vertical location of the whiskers?
Thanks - Ariel
Aren’t those generically calculated from the data?
–
Gökhan
–
Ariel Rokem
Helen Wills Neuroscience Institute
University of California, Berkeley
http://argentum.ucbso.berkeley.edu/ariel
–
Gökhan
–
Ariel Rokem
Helen Wills Neuroscience Institute
University of California, Berkeley
http://argentum.ucbso.berkeley.edu/ariel
–
Gökhan