Best way to plot word embedding data in vector space?

Hi everyone!

I am working with word embedding data with the BERT model. What I have is as below -

image
What I want to do is plot these texts using their cosine distances(marked distance in the DataFrame) in a vector space, similar to the picture below -


What would you recommend as the most efficient way to achieve this?

That appears to be a combination of ax.scatter and ax.annotation. What have you tried and what went wrong? It is much easier to help you if we have a minimal code example to start from.

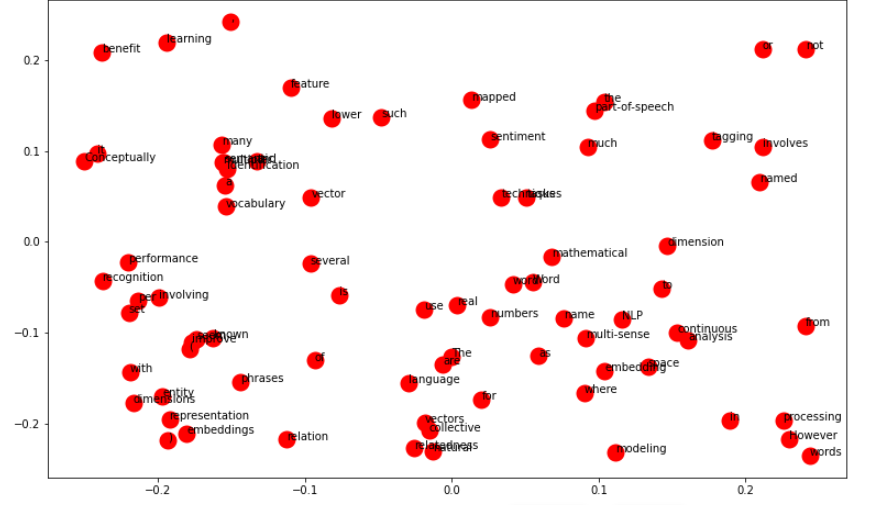
Hi, I’ve managed to get all the points to show now by calculating the X and Y from cosine and euclidean distances. Thanks to your guidance of pointing out the ax.annotation method, I got the labels as well. As the labels seem far too large at the moment, is there a way to make them appear on hover?

See mplcursors – Interactive data selection cursors for Matplotlib — mplcursors 0.5.1 documentation for some nice tools and Event handling and picking — Matplotlib 3.5.3 documentation / Event handling — Matplotlib 3.5.3 documentation for the underlying functionality.