Best way to modify plot / subplot

Hi All,

I'm looking for some suggestions about two problems:

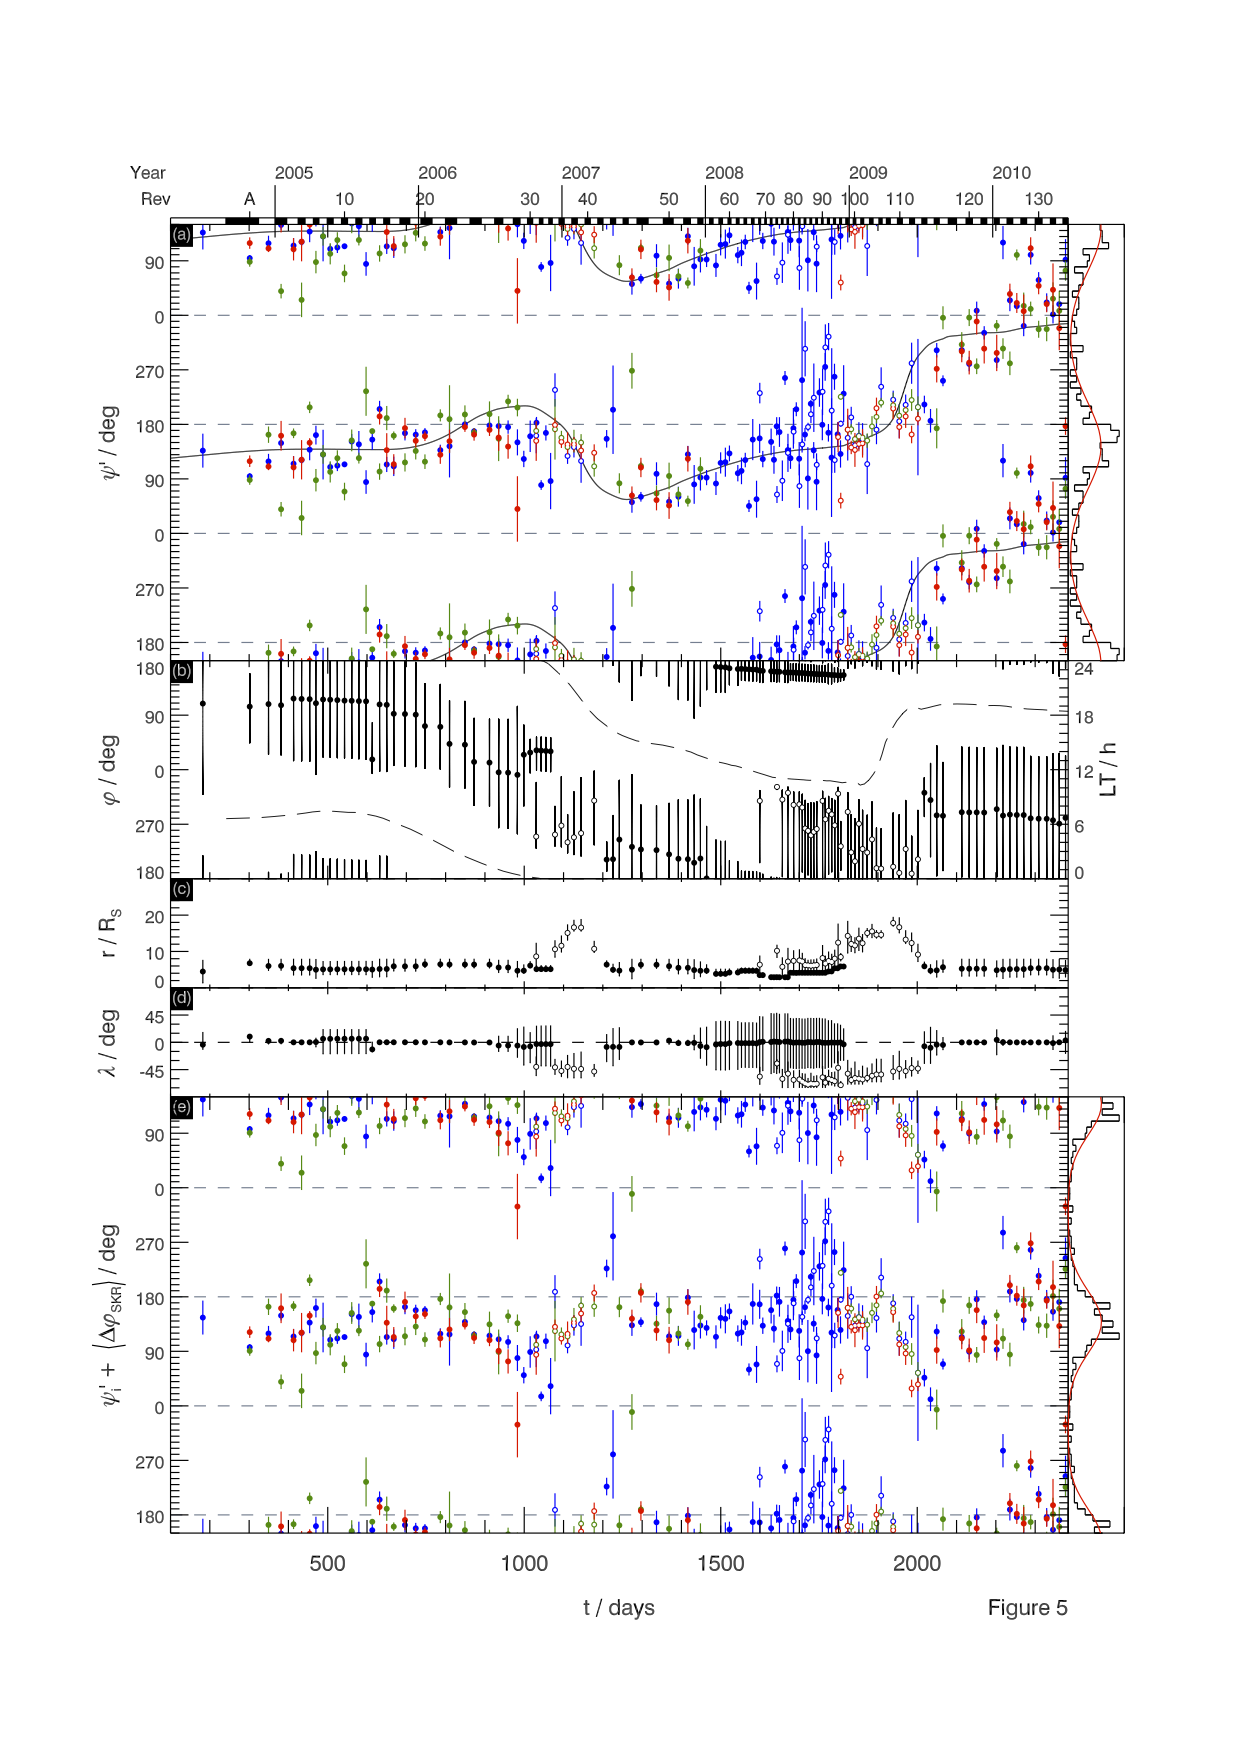
1) I'm converting some figure generating code from IDL into
Python/matplotlib. Image attached showing this figure.
IDL being a functional programming language for the most part,
creating wrappers around various subroutines is trivial and generally
the simplest way to modify their behavior.
For example, in dealing with phase data (which can take values between
0º and 360º, and are 'wrapped' around this interval, such that 270º +
180º = 90º and so on), I have some stuff in IDL that instead over
simply 'overplotting' some (x,y) data, it will do a quick loop and
instead overplot (x, y + n * 360º) for n = -1, ..., 1 (or some other
number of repetitions, you get the idea).

Now, in matplotlib, while I can do this pretty easily, I suspect there
are better ways? I suppose I could write a subclass of
matplotlib.axes.Axes for example, that does the 360º repetition itself
across not just the plot() method but for others also? But
implementing a whole new class for this may be complicated, and I am
sort of lost as to how I would then get that working with the pylab
stateful interface?

I'm reasonably new to OO programming, and I'm still getting my head
round the 'best' way to do things like this.

Alternatively, having a class that describes individual data points, I
could define a plot() method for them?

class MyData():
    ...
    plot(self, axes):
        ...
        axes.plot(self.x, self.y + n * 360)

But then, that seems to 'break' some rules, as I don't see much
matplotlib code in which you do 'data.plot()' as opposed to
'axes.plot()' - the order seems wrong?

2) Somewhat similar to the first question. The figure includes (at
the top) some ancillary data (showing lengths of orbit and year
numbers). In IDL its done simply by filling polygons in normal / page
coordinates - but again, I think it could be better done using OO
somehow? Effectively, that top row could be thought of as a separate
subplot. What would be the efficient / sensible / pythonic way to go
about reproducing this. Another subclass of Axes?

Many thanks,

Dave

Figure.png

Dave,

Generally speaking, if your first thought is “Should I subclass the Axes class?” then you might need to take a second look at what matplotlib has to offer out of the box. Granted, the graph you wish to duplicate is very complex, but let us break it down into various components.

First, you want multiple subplots to appear vertically “stacked” and share the same x-axis. Here is an example of how to do that:

http://matplotlib.sourceforge.net/examples/pylab_examples/ganged_plots.html

(Note that I personally advocate against the “from pylab import *” code style, and this example could easily be redone from the pyplot interface instead.)

Here is another example where the person used LineCollections with defined offsets. This has the advantage of using a single axes object, but might be difficult to handle the y-axis.

http://matplotlib.sourceforge.net/examples/pylab_examples/mri_with_eeg.html

To have multiple x-axis tick labels for a common y-axis is a concept called twiny. The following is an example of doing twinx (multiple y-axis tick labels for a common x-axis), but the concept is the same:

http://matplotlib.sourceforge.net/examples/api/two_scales.html

This is another example showing a different way of doing that:

http://matplotlib.sourceforge.net/examples/axes_grid/simple_axisline4.html

As for some of the markings around the graph, I am not entirely certain how to implement that. I will leave that for others to suggest ideas for.

I hope this is helpful!
Ben Root

···

On Sun, Feb 27, 2011 at 4:49 PM, David Andrews <irbdavid@…287…> wrote:

Hi All,

I’m looking for some suggestions about two problems:

  1. I’m converting some figure generating code from IDL into

Python/matplotlib. Image attached showing this figure.

IDL being a functional programming language for the most part,

creating wrappers around various subroutines is trivial and generally

the simplest way to modify their behavior.

For example, in dealing with phase data (which can take values between

0º and 360º, and are ‘wrapped’ around this interval, such that 270º +

180º = 90º and so on), I have some stuff in IDL that instead over

simply ‘overplotting’ some (x,y) data, it will do a quick loop and

instead overplot (x, y + n * 360º) for n = -1, …, 1 (or some other

number of repetitions, you get the idea).

Now, in matplotlib, while I can do this pretty easily, I suspect there

are better ways? I suppose I could write a subclass of

matplotlib.axes.Axes for example, that does the 360º repetition itself

across not just the plot() method but for others also? But

implementing a whole new class for this may be complicated, and I am

sort of lost as to how I would then get that working with the pylab

stateful interface?

I’m reasonably new to OO programming, and I’m still getting my head

round the ‘best’ way to do things like this.

Alternatively, having a class that describes individual data points, I

could define a plot() method for them?

class MyData():

...

plot(self, axes):

    ...

    axes.plot(self.x, self.y + n * 360)

But then, that seems to ‘break’ some rules, as I don’t see much

matplotlib code in which you do ‘data.plot()’ as opposed to

‘axes.plot()’ - the order seems wrong?

  1. Somewhat similar to the first question. The figure includes (at

the top) some ancillary data (showing lengths of orbit and year

numbers). In IDL its done simply by filling polygons in normal / page

coordinates - but again, I think it could be better done using OO

somehow? Effectively, that top row could be thought of as a separate

subplot. What would be the efficient / sensible / pythonic way to go

about reproducing this. Another subclass of Axes?

Many thanks,

Dave

David, the preferred way to custom plots seems to be passing an Axes
instance to the plotting function. Some tricks allow use of
pylab/pyplot style:

def custom_plot(x, y, axes=None):
    ...
    if axes is None: axes = pyplot.gca()
    axes.plot(x, y)
    ....

What you don't get this way is the axes.custom_plot(x, y) sintax,
which requires subclassing Axes. But doing this is not common and not
straighforward if you want it to work well with pyplot.subplot() and
the like.

Maybe monkey patching would work but well, you know... I never tried it anyway.

Goyo