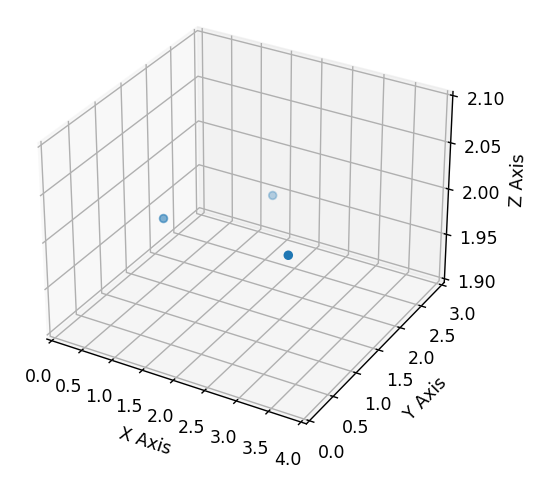
I have the following Python 3.10 script to generate a simple 3D Scatter Plot with MatPlotLib , according to the MatPlotLib 3D Scatter tutorial:
import matplotlib.pyplot as plt

fig = plt.figure()
ax = fig.add_subplot(projection='3d')

X = [1, 3, 2]
Y = [1, 1, 2]
Z = [2, 2, 2]

ax.scatter(X, Y, Z)

ax.set_xlim(0, 4)
ax.set_ylim(0, 3)
ax.set_zlim(1.9, 2.1)

ax.set_xlabel('X Axis')
ax.set_ylabel('Y Axis')
ax.set_zlabel('Z Axis')

plt.show()
The script above works as intended, and I get the correct output:
However, I was wondering whether it would be possible to connect & fill the scatter points, to create a “face” of sorts, and to provide a color for it. In this case, it would be as such:
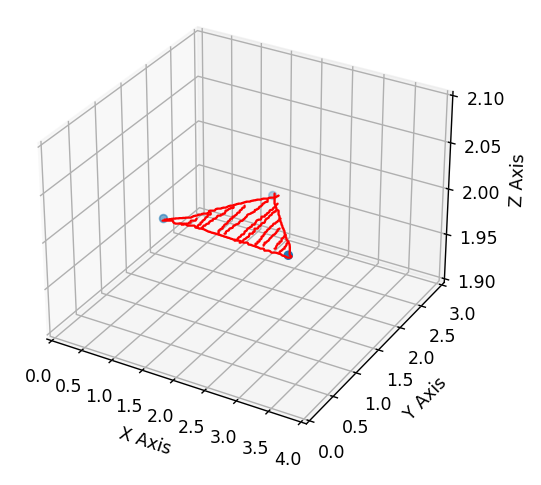
I looked around the other MatPlotLib tutorials, notably the ones for the 3D Surface Colormap plot and the 3D Surface Solid Color plot, however it’s confusing to me how they are implemented.
From what I could gather by attempting to run the examples, the Z-axis data set is a multi-dimensional array (the interperter threw up an error if I simply supplied a singular list or np array to it). I don’t really understand why the Z-axis data set needs to be a multi-dimensional array, as I would imagine that the actual data colors are supplied via the color argument to the scatter function call.
Is what I’m trying to do even possible with MatPlotLib? Is there a better way to approach this?
Thanks for reading my post, any guidance is appreciated!