I'm a CFD student and I wish to learn to make high-quality plots from my
calculations using matplotlib. However, I'm a complete novice in using
matplotlib and python and I didn't find any earlier posts so here goes.
I have data form Ansys Fluent in the following form
continuity x-velocity y-velocity energy
k epsilon
1 0.00011115784 1.5359586e-07 1.0506172e-07 0.0032920227
0.40809903
1 0.16584706 0.0047719572 2.7355736e-07
0.026478255 0.19814095
0.5674 0.044237841 0.0026294924 2.8202695e-07 0.030139321
0.13935529
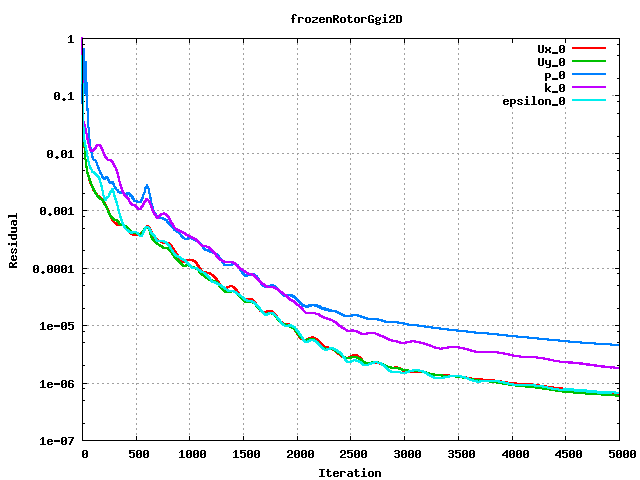
The first line is for the first iteration, the second line for the second
iteration etc. Basically, I would like to have plot this data and have a
picture like http://openfoamwiki.net/images/f/ff/Pump_residuals.png this
First, you would load your data using numpy’s loadtxt() function. You can tell loadtxt() to skip the first line since it is a header. This will give you a 2-D array (n rows and 6 columns) where n is the number of iterations.
You can then plot the data using matplotlib’s plot command (or semilogy to automatically get y-log scaling), passing in the first column for the x data, and then the other columns for the y data.
So, your code would look something like this:
import numpy as np
import matplotlib.pyplot as plt